How to troubleshoot the DHIS2 Android App
As some users might have problems or experience bugs while using the DHIS2 Android App (referred simple as App during this guide) we have prepared this guide which explains the common troubleshooting tasks that you could perform in order to:
-
understand the issue
-
solve the problem (if it is due to a configuration issue)
-
submit a detailed bug report in JIRA
The first important thing to know is that with every release of the App the Android team releases two different versions of the App, the production and the training one. In the past the training was targeted to those users doing training or testing as it was more relaxed in terms of permissions (i.e. it allowed taking screenshots), however this differentiation is somehow gone as even in the production version users could take screenshots if configured specifically. But training still include some libraries that are removed from the production App as they allow a skilled user to understand things that might be happening internally and extract data. That is the main reason it is recommend to use the training App only in testing or debugging phase but never in production.
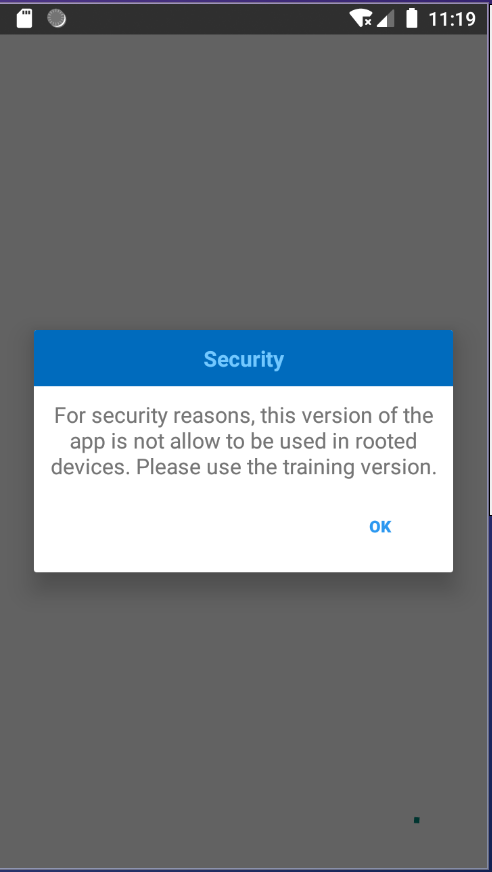
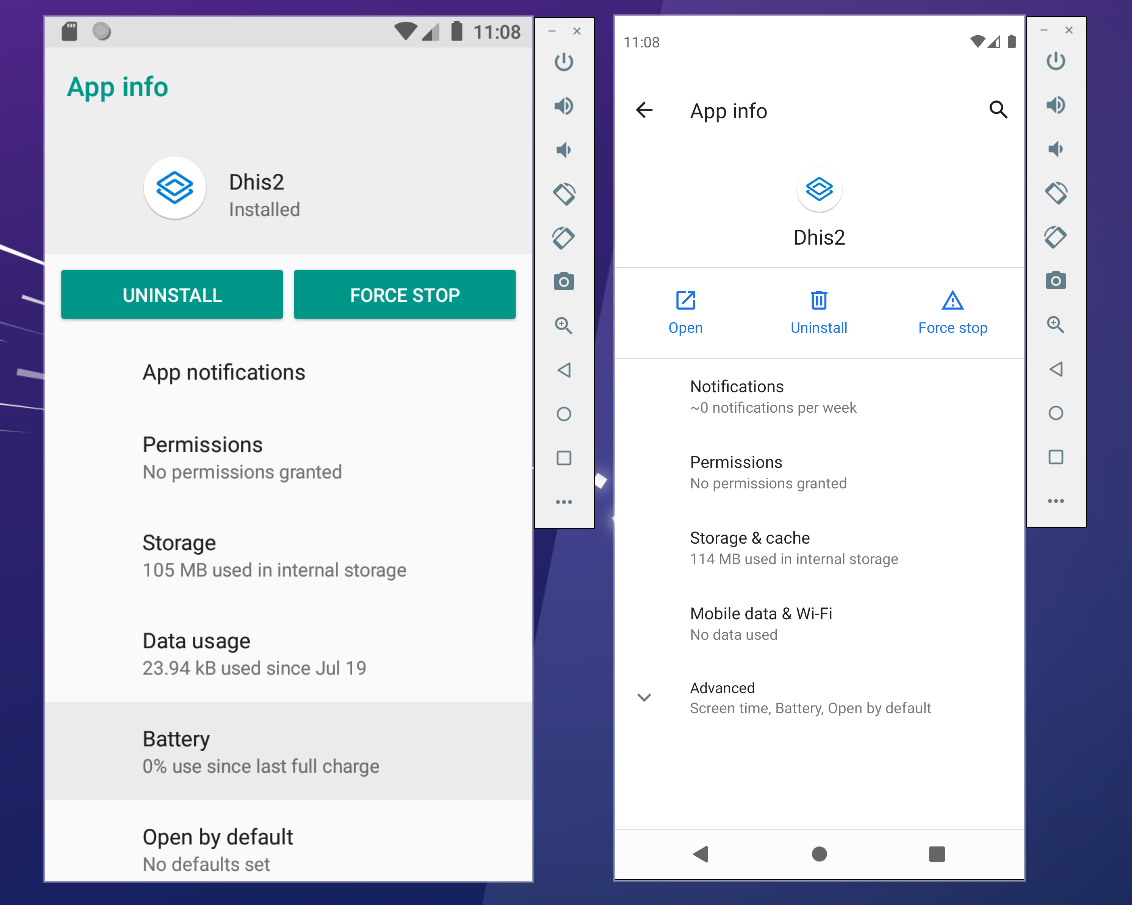
Another important thing to know is that the production App cannot run in a rooted device for the same reason; as in those cases a malicious user could extract sensitive information from the App. In fact, trying to run the App in a rooted phone will lead to the following message:
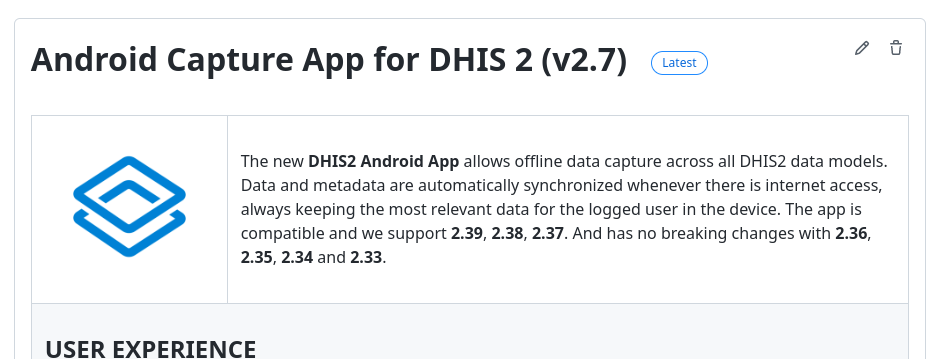
The picture below shows the two versions of the App for the 2.7 release from Github. Note that in this case there are no two but three versions as at the moment as before 2.7 the SMS capabilities were not present in the Google Play store due to some validation issues. This is no longer an issue (and we are keeping it currently for transitional purposes). Also note that as documented, the production APK has a different SMS workflow in the Google Play and the Github version to achieve the same result due to the same limitations mentioned before.
Scrcpy
This is fully covered in the CoP post: How to clone your Android screen (useful for: presentations, debugging, etc)
Emulator
An emulator is a tool that can be used to make your computer behave like an Android device and therefore run the DHIS2 Android App. Although you might be doing most of your troubleshooting in a physical device having an emulator (or several) is a great way to speed up the testing process as you might have different emulators (simulating different devices that you might be using in your implementation i.e. tablets, different versions of Android, etc) and even different versions of the App.
There are many ways emulators that you can run on your computer and it will depend on several factors like which OS you are running among others. In this guide we will only cover briefly the Android Virtual Device because it is free and quite straightforward to set up from Android Studio but you might find any other alternative more suitable.
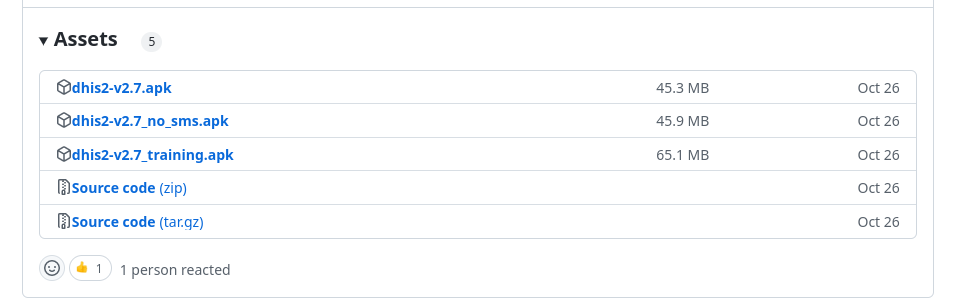
In the Android Studio go to Tools > Device Manager
This will open a new window where you can set up the different devices. Note that you will need to download the Android images before creating any device (this means downloading a big image ~700MB per Android version). Afterwards you should be able to create different emulators with different specifications. For example, in the image below we show how we have created three emulators: two are running Android version 11 while being different devices (one tablet, one phone) and where we have installed different versions of the App (2.6.2 and 2.6.1); the other one is running an Android version 8.
With this proposed set we could quickly jump between different versions of the App or even have the two running at the same. We are showing an example of having the two emulators running below which could allow us to quickly see the differences of the App and perform certain actions (like updating your manuals, testing use cases, etc).
More information about how to set the emulator can be found in the official Android Studio guide: https://developer.android.com/studio/run/managing-avds
Also note that there are other alternatives that would allow you to run physical Android devices (not emulators) online, and although pricey this can be another solution of testing in the real devices that you would use on your implementation.
Flipper
Flipper (https://fbflipper.com/) is a tool developed by Facebook that allows you to perform several operations that can be very helpful while troubleshooting. In this guide three of those are presented: Logs (the log viewer), Network (the network inspector) and Databases (the database interface) which can be accessed from the menu of the main screen (on the left side). For installation of the tool please refer to the official website (insert link).
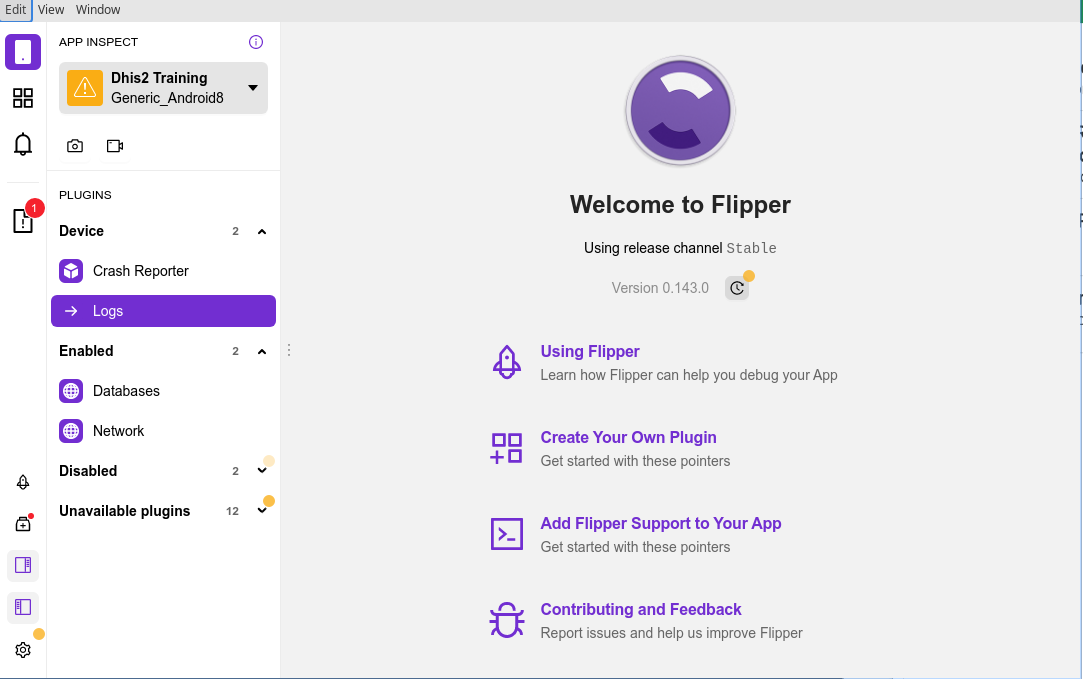
Once the tool is properly installed and any Android device connected it should be displayed on the device list (in the upper left corner). Please note that if you don’t see the device you might have not properly installed the tool; please refer to the installation guide from the website. And if some of the options listed below are not listed might be the case that you are not running the training version of the App.
Logs
The log viewer can be used to inspect the logs of the device. This would be the same as running ‘adb logcat’ in a console with the advantage that with Flipper there are filters that can be added on the flight and simplify displaying specific logs related to the App. In the image below you can see how this is being used by filtering the messages of the DHIS2 App and therefore focusing on what might be important.
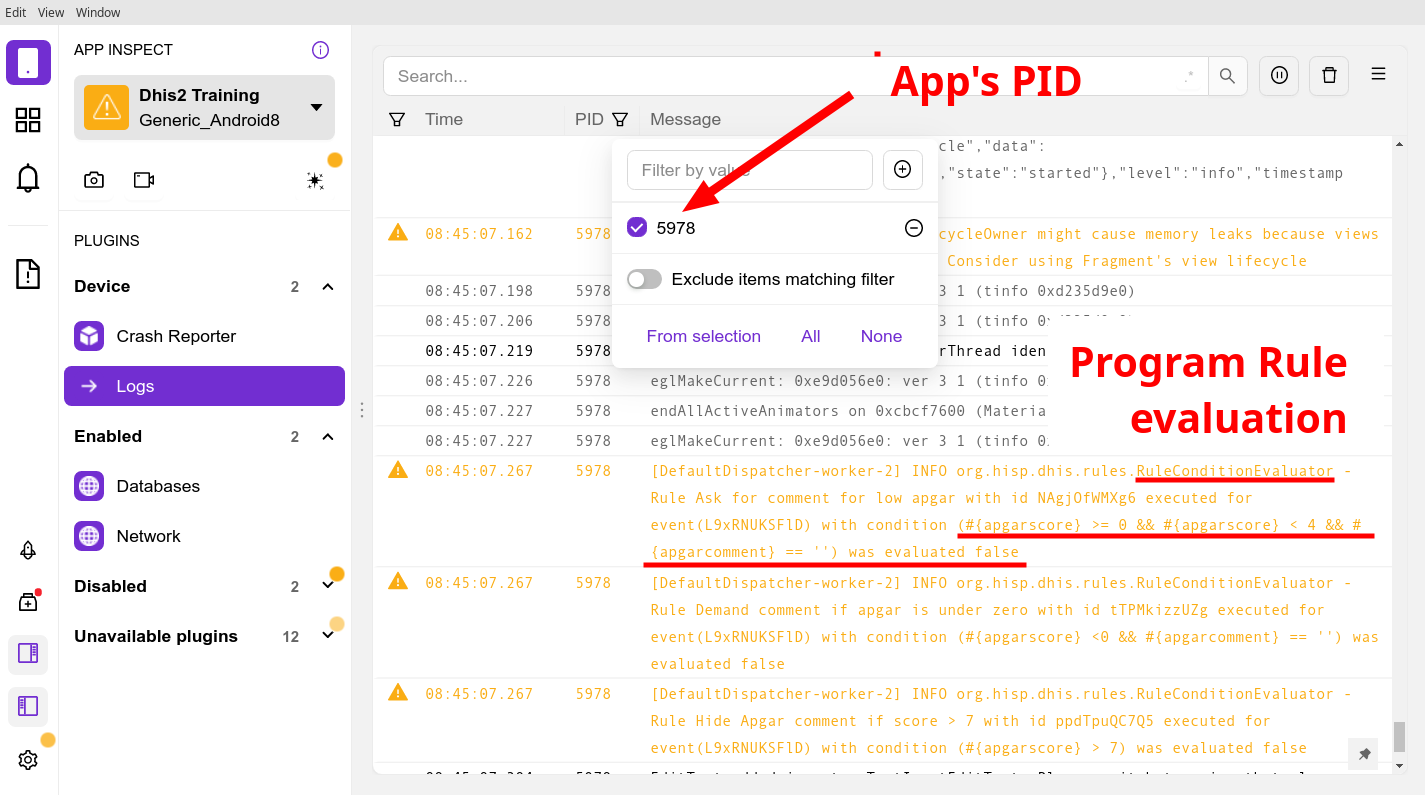
In the example above we can see how the logs can already be helpful to understand what is going under the hood. In this case by computing and presenting the result of the Program Rules in a specific Program Stage.
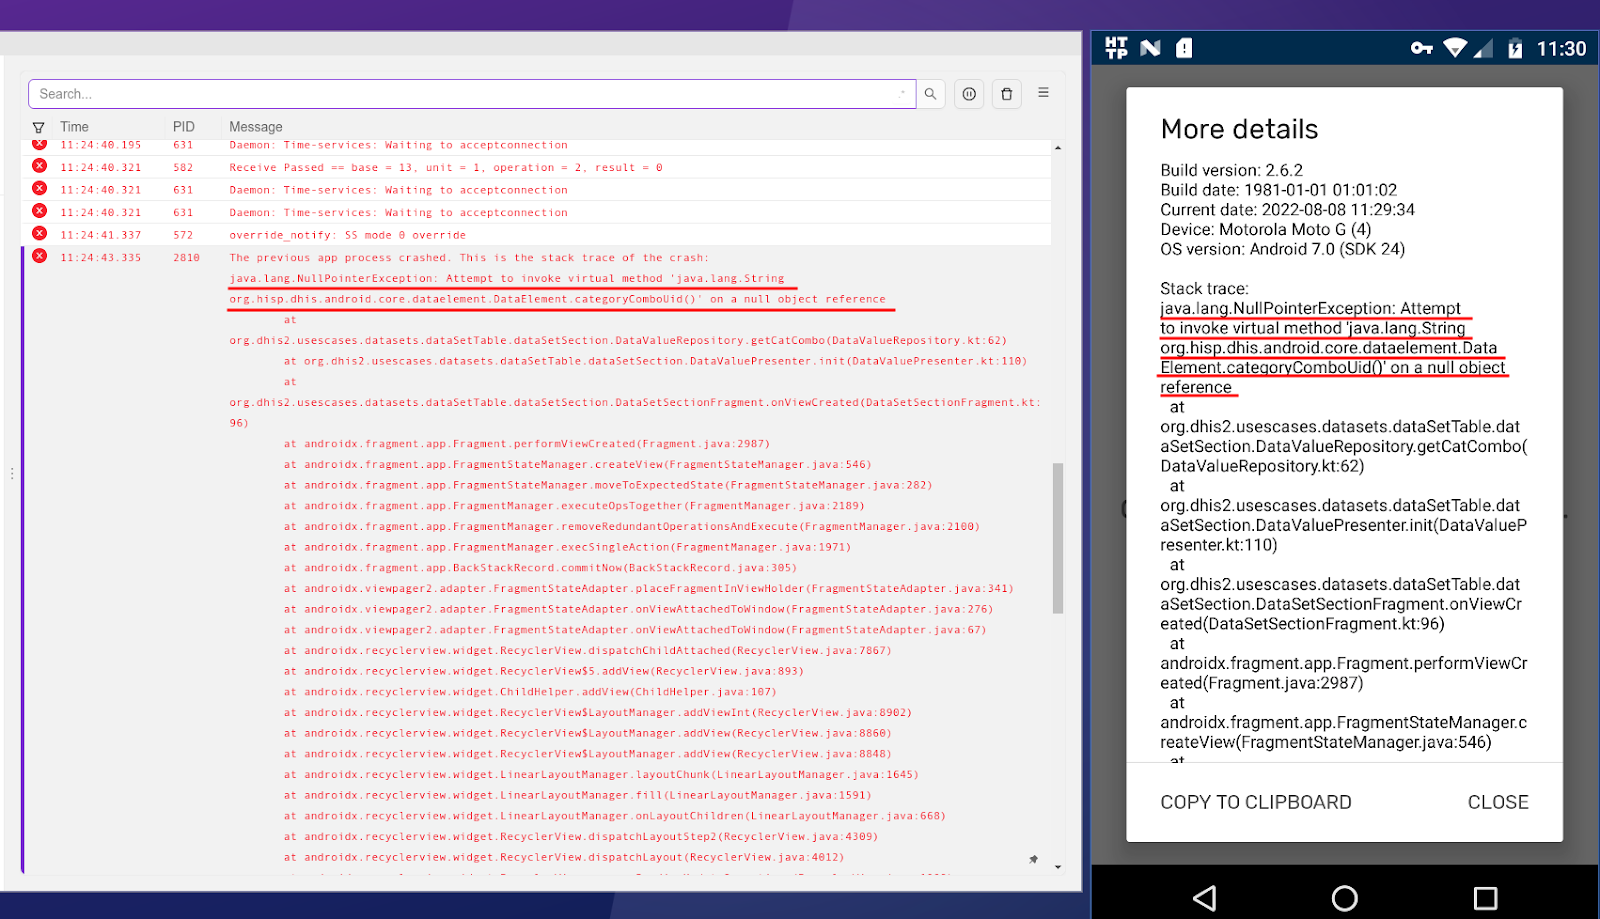
Another example that could lead to reporting a JIRA ticket if it is confirmed to be a bug in the App. In the one below the user has a corrupted local database and therefore the Application is crashing when performing certain operations. The message found in the Logs usually matches the one displayed in the App (clicking on More Details) when the crash appears although sometimes it might not be available under very critical crashes.
Network
The network is another very useful tool to understand how the App interacts with the server via API calls, in fact, it will output all the calls between the App and the server and their responses (apart from some headers, etc). Although we will not be able to modify the calls or the responses, it can help when having problems with wrong responses from the server (in case of issues or bugs in the backend) where we will have to go to dig further.
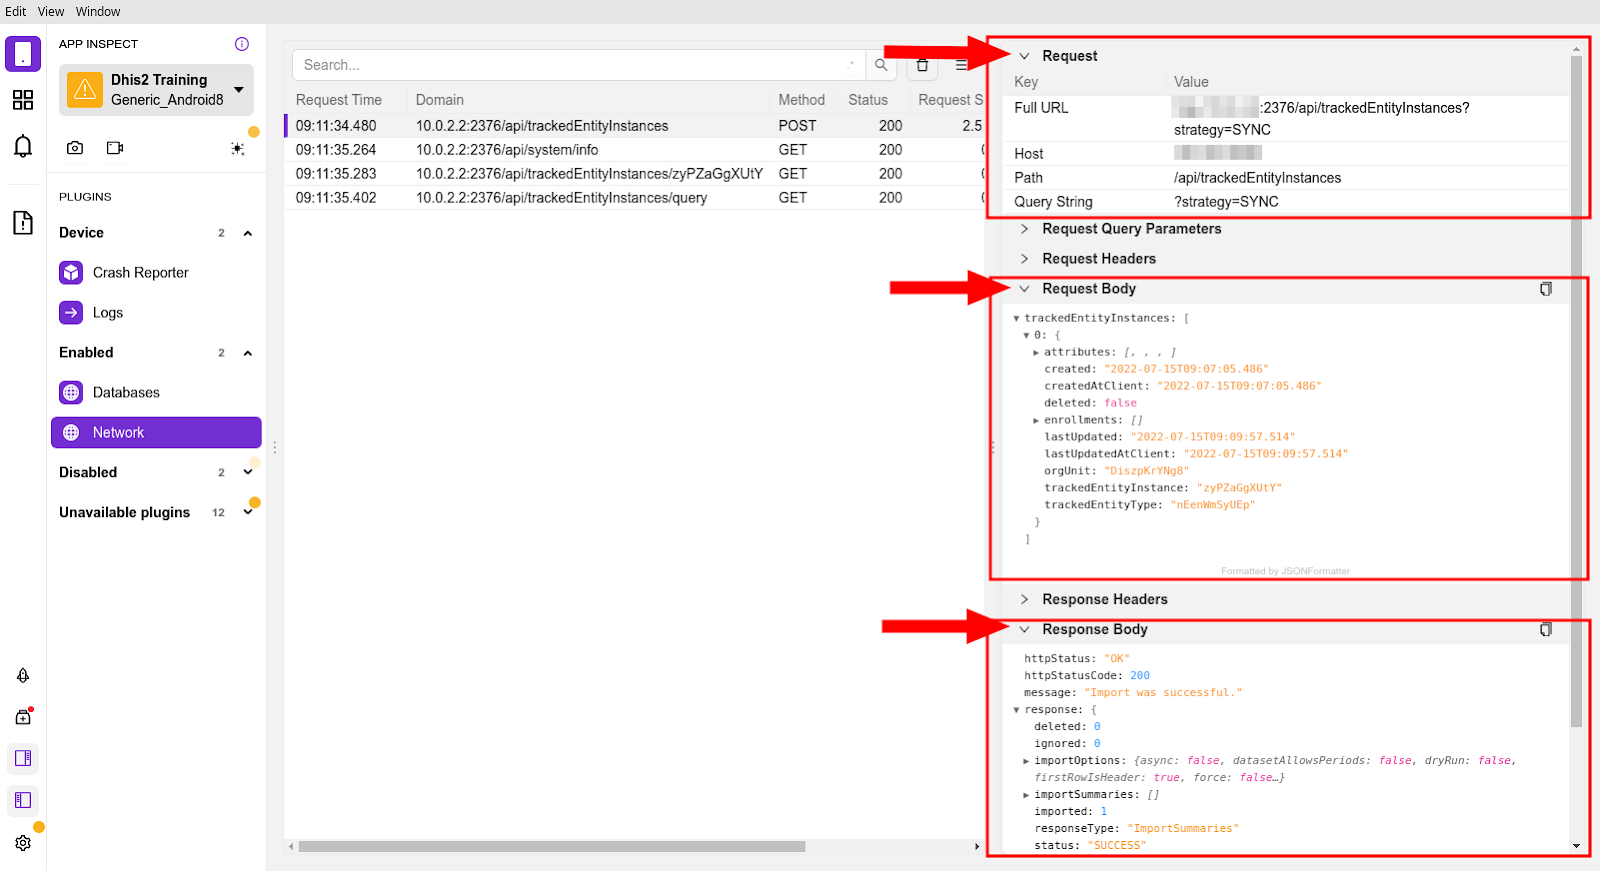
In the image below we can see what is happening when the user has performed a granular synchronization of a single TEI with the specific API call and the response from the server.
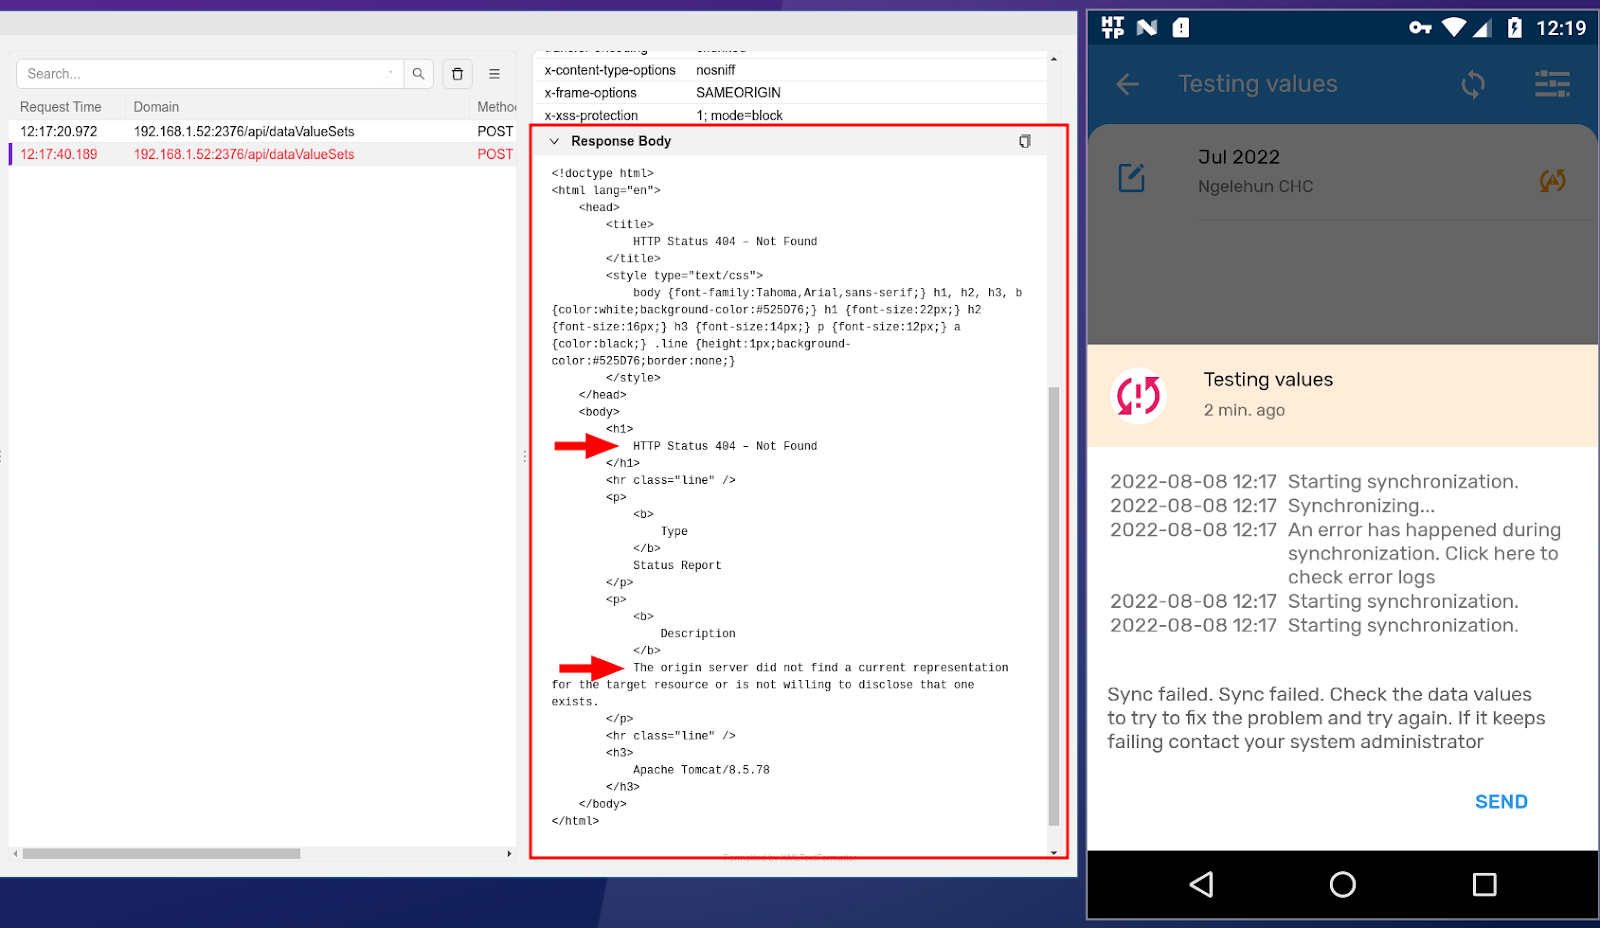
In another example we could see how the server is the one misbehaving, for example, when attempting to perform a DataSet synchronisation we can see how the App displays an error and in the response we might obtain more details of that error (in general, when this happens the App should capture the response and present the error to the user, if it is not the case it is due to an uncapture exception and reporting it in JIRA will mean adding it to future versions). In this case it seems the server is accepting the requests but it is replying with a 404 so there might be an issue while rerouting our requests that needs to be investigated on the backend.
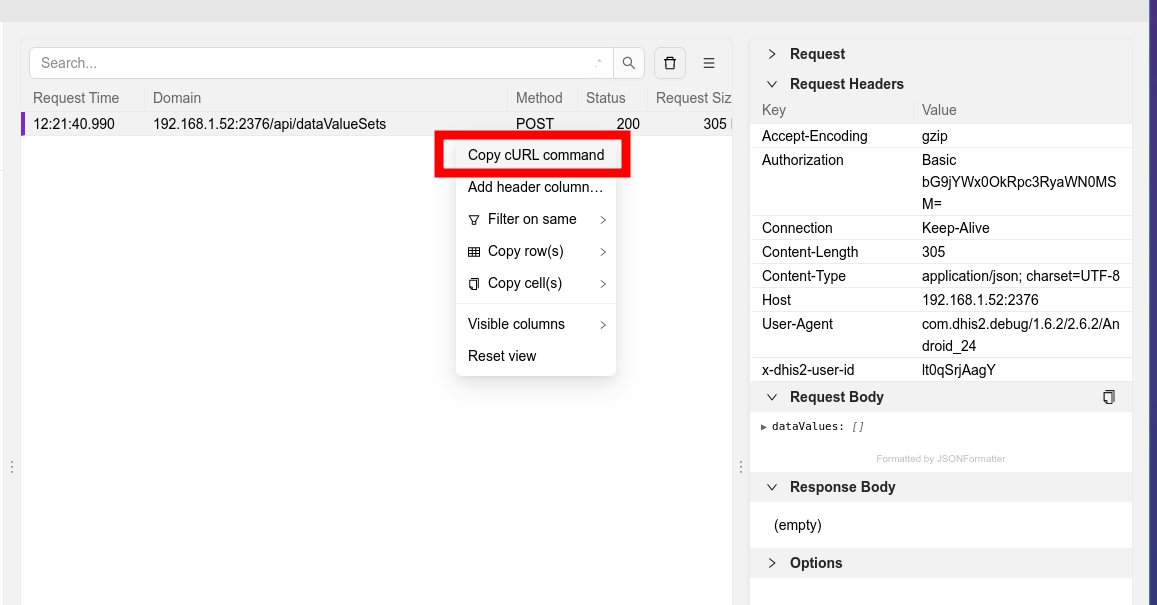
We could also extract the API call and perform it manually from a computer (right clicking on the call allows copying the cURL command) which could help troubleshooting much faster. In fact, performing this API call again via cURL and going to the server log’s we can figure out that there is a problem (very likely due to a bug) as an exception is being thrown. We could also play with the API call to see if it is varying if we get the exception, etc.
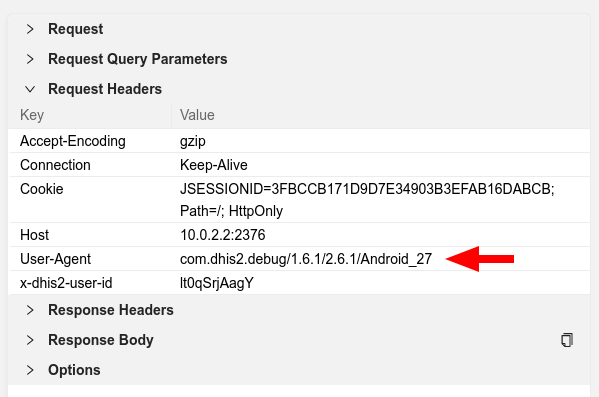
Another thing that the network inspection allows us to see the headers of the API calls. These headers can be helpful for many things, but, as an example we can see the User-Agent of the calls. As explained in the System Administration Guide this could be used to implement blocks at the web proxy level for specific versions of the App.
Database
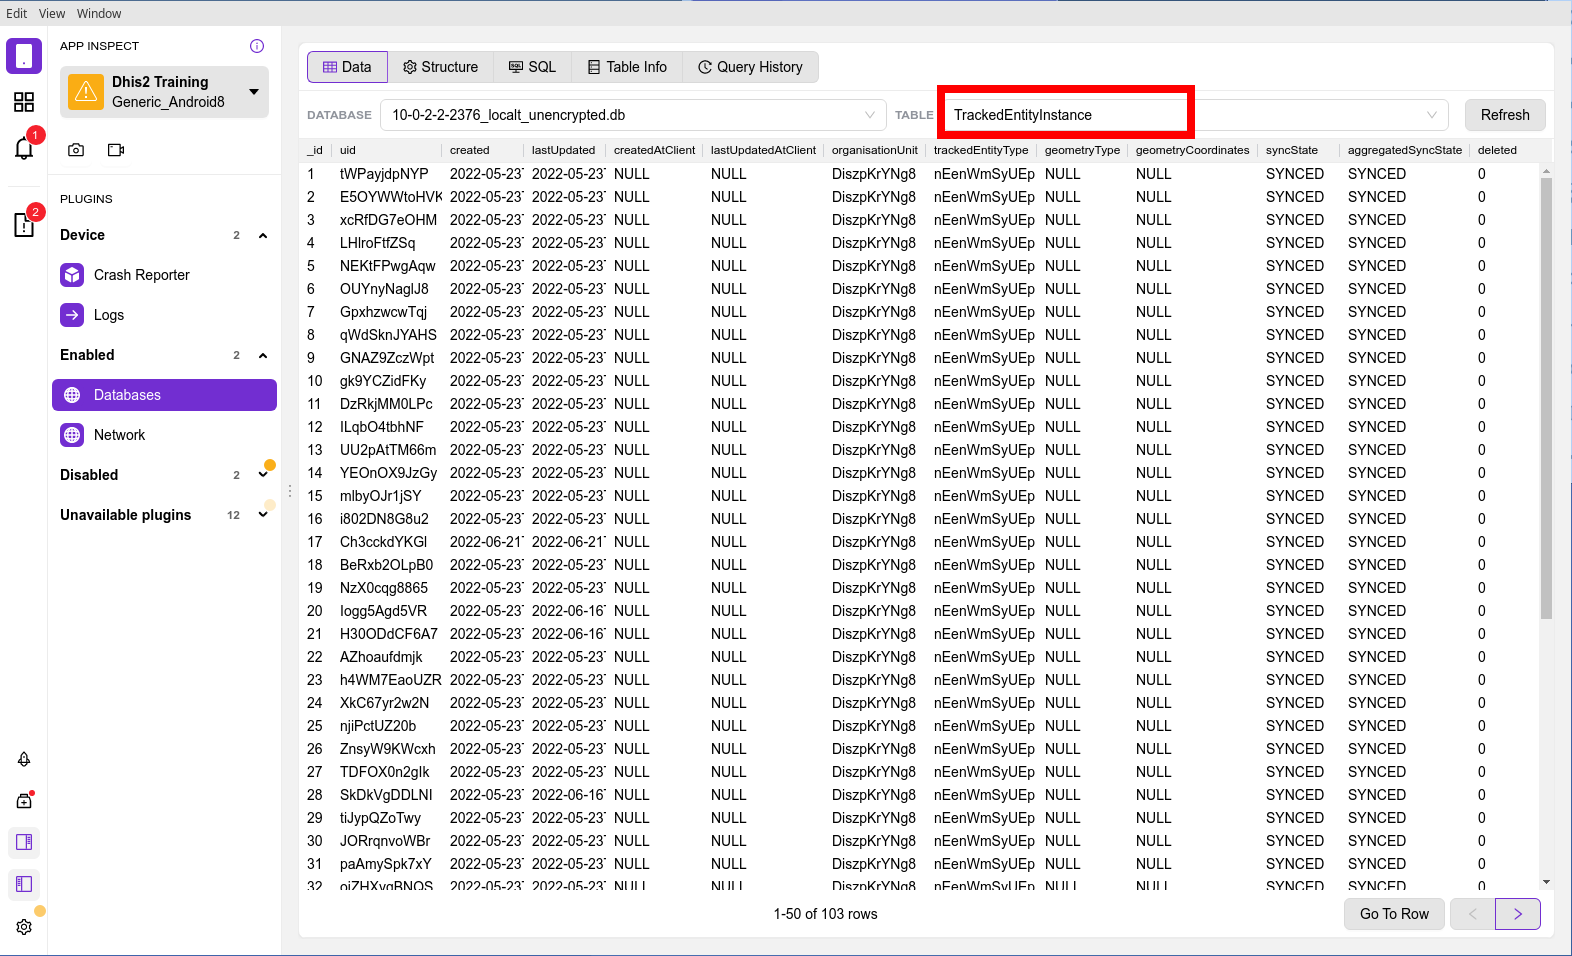
The database tool is the last one we will be covering in this guide and which allows us to inspect the database in a graphical way but also to perform SQL operations. This requires a deep understanding of the DHIS2 server database as the App implements very similar tables where the information is stored.
In the image below, we can see how we could inspect the TEI table to have a quicker overview of all the TEIs tin the device instead of having to open one per program.
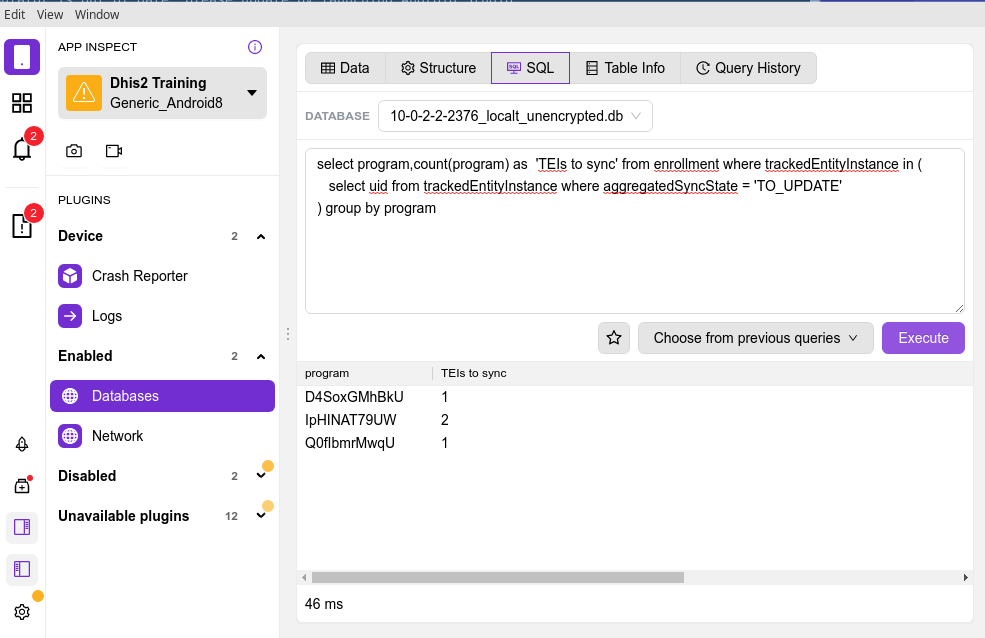
As an example of how this could be used could be counting the number of TEIs that are not synced with the server, which could be accomplish by the following SQL query. This is something that is not available in the App in any case but we could use to see how many TEIs would be synced when performing the “Sync Data” operation.
select program,count(program) as ‘TEIs to sync’ from enrollment where trackedEntityInstance in (
select uid from trackedEntityInstance where aggregatedSyncState = ‘TO_UPDATE’
) group by program
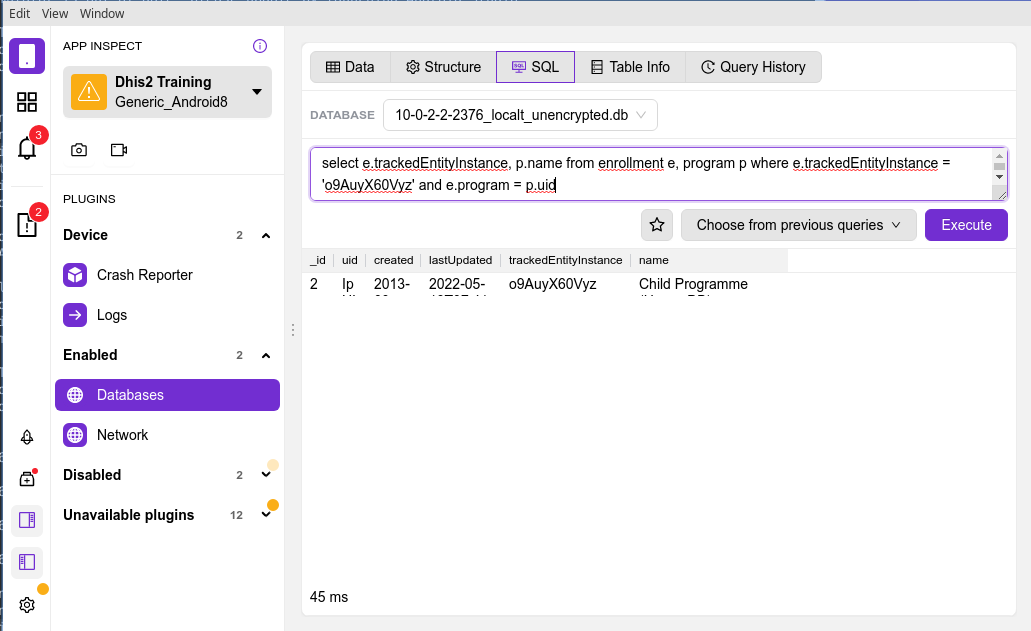
Another operation that we could perform is checking if a specific TEI is present in the phone. For this we could use the search form of the program itself via the App interface but in a very specific scenario (imagine a program where we can only search by First Name and Last Name and there are many different John Does) if we knew the UID of that TEI (because we have extracted if from the server) the following query would let us know if the TEI is on the phone database and in which specific program is enrolled.
select e.trackedEntityInstance, p.name from enrollment e, program p where e.trackedEntityInstance = ‘o9AuyX60Vyz’ and e.program = p.uid
Other tools
In this guide we have included the main tools we use for support and that can help while troubleshooting or reporting bugs. In the future we might add some more tools that we use and we are listing here in case you want to already have a look:
- HTTP Toolkit: to intercept and manipulate HTTP requests
- Android Studio: to debug the App and understand what’s happening with the code of the App.
- The debugging process for Program Rules is already available in the Github wiki: Debugging the program rules · dhis2/dhis2-android-capture-app Wiki · GitHub
- Custom developed scripts: to manipulate Android emulators via the ADB shell to achieve repetitive tasks.
- Video recording application: to record the Android screen to submit bugs or share knowledge.