Hi All,
I will highly appreciate if any one could help me with a guide to
install ubuntu server edition on my server.
Thanks
Stephen
Hi All,
I will highly appreciate if any one could help me with a guide to
install ubuntu server edition on my server.
Thanks
Stephen
Hi Stephen, i think this link can be of help.
http://www.computer-howto.com/2011/10/installing-ubuntu-server-1110-x64-step-step/
cheers
On Thu, Nov 17, 2011 at 1:51 PM, Stephen Gbanyan mambu9@gmail.com wrote:
Hi All,
I will highly appreciate if any one could help me with a guide to
install ubuntu server edition on my server.
Thanks
Stephen
Mailing list: https://launchpad.net/~dhis2-users
Post to : dhis2-users@lists.launchpad.net
Unsubscribe : https://launchpad.net/~dhis2-users
More help : https://help.launchpad.net/ListHelp
–
You can do anything, but not everything.
Hi Stephen,
I have install Ubuntu but a blank screen appear. I need some more
help. My skype is mambu9 so if you have skype you can add me to your
contact and help.
Thanks
Stephen
On 11/17/11, Ocaya Stephen <stephocay@gmail.com> wrote:
Hi Stephen, i think this link can be of help.
http://www.computer-howto.com/2011/10/installing-ubuntu-server-1110-x64-step-step/
cheersOn Thu, Nov 17, 2011 at 1:51 PM, Stephen Gbanyan <mambu9@gmail.com> wrote:
Hi All,
I will highly appreciate if any one could help me with a guide to
install ubuntu server edition on my server.Thanks
Stephen
_______________________________________________
Mailing list: DHIS 2 Users in Launchpad
Post to : dhis2-users@lists.launchpad.net
Unsubscribe : DHIS 2 Users in Launchpad
More help : ListHelp - Launchpad Help--
*You can do anything, but not everything.*
Hi stephen, I hope you manage to install the Ubuntu linux server from the stage we lost conversation on configuring home directory for encryption.
Cheers
On Thu, Nov 17, 2011 at 5:31 PM, Stephen Gbanyan mambu9@gmail.com wrote:
Hi Stephen,
I have install Ubuntu but a blank screen appear. I need some more
help. My skype is mambu9 so if you have skype you can add me to your
contact and help.
Thanks
Stephen
On 11/17/11, Ocaya Stephen stephocay@gmail.com wrote:
Hi Stephen, i think this link can be of help.
http://www.computer-howto.com/2011/10/installing-ubuntu-server-1110-x64-step-step/
cheers
On Thu, Nov 17, 2011 at 1:51 PM, Stephen Gbanyan mambu9@gmail.com wrote:
Hi All,
I will highly appreciate if any one could help me with a guide to
install ubuntu server edition on my server.
Thanks
Stephen
Mailing list: https://launchpad.net/~dhis2-users
Post to : dhis2-users@lists.launchpad.net
Unsubscribe : https://launchpad.net/~dhis2-users
More help : https://help.launchpad.net/ListHelp
–
You can do anything, but not everything.
Mailing list: https://launchpad.net/~dhis2-users
Post to : dhis2-users@lists.launchpad.net
Unsubscribe : https://launchpad.net/~dhis2-users
More help : https://help.launchpad.net/ListHelp
–
Samuel Cheburet
Ministry Of Health
P.O. Box 20781
Nairobi, Kenya
Mobile- 0721624338
“When you cease to dream you cease to live, Neither you nor the world knows what you can do until you have tried”.
*“Chance favours the prepared mind” -Louis Pasteur
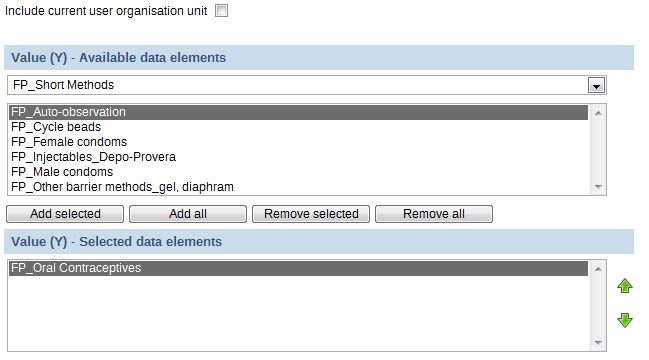
I’m not sure if anyone noticed this yet, but the data element selection dialog for the chart module does not function correctly, it allows you to select data elements, but it does not display category combinations. In our case FP_Oral Contraceptives should display sub categories (New Users) or (Continuing Users).
In case this is any help, here is the URL on our local network copy. Using Version: 2.5 Build revision: 4982
If anyone tries to create a chart like this they will get a mix of apples and oranges.
Most of the other data element selection dialogs work correctly… eg in the GIS module, and when creating indicator definitions.
Has this bug been fixed?
Randy Wilson, Rwanda
There is no support for categories in charts. You can only get the totals for the data elements. It is actually the same also in GIS or Data Visualizer. The only places where data analysis on category level is supported is using data set reports (obviously), report tables/standard reports (use the report table type called Data Element Dimension Table), in excel pivots connected to mydatamart, and via the use of indicators you can display category-level data in all modules (cumbersome, but can be done).
This is why I am always preaching that the categories should be designed so that the total for the data element makes sense for data analysis, and not just to make the auto form look good.
Ola
On 18 November 2011 09:25, Wilson,Randy rwilson@msh.org wrote:
I’m not sure if anyone noticed this yet, but the data element selection dialog for the chart module does not function correctly, it allows you to select data elements, but it does not display category combinations. In our case FP_Oral Contraceptives should display sub categories (New Users) or (Continuing Users).
In case this is any help, here is the URL on our local network copy. Using Version: 2.5 Build revision: 4982
If anyone tries to create a chart like this they will get a mix of apples and oranges.
Most of the other data element selection dialogs work correctly… eg in the GIS module, and when creating indicator definitions.
Has this bug been fixed?
Randy Wilson, Rwanda
Mailing list: https://launchpad.net/~dhis2-users
Post to : dhis2-users@lists.launchpad.net
Unsubscribe : https://launchpad.net/~dhis2-users
More help : https://help.launchpad.net/ListHelp
Hi Ola,
Thanks for the quick reply. In this case I guess the only solution is to rely on the Indicator module and to create “data elements” as indicators of number type that reflect the needed categories.
Would it not be relatively simple to modify the chart and GIS modules so that they pull from the data element category combo boxes in the Indicator definition dialogs? Is this in a blueprint somewhere?
Randy Wilson
From: olatitle@gmail.com [mailto:olatitle@gmail.com] On Behalf Of Ola Hodne Titlestad
Sent: Friday, November 18, 2011 10:55 AM
To: Wilson,Randy
Cc: dhis2-users
Subject: Re: [Dhis2-users] Problem with data element selection in Chart module
On 18 November 2011 09:25, Wilson,Randy rwilson@msh.org wrote:
I’m not sure if anyone noticed this yet, but the data element selection dialog for the chart module does not function correctly, it allows you to select data elements, but it does not display category combinations. In our case FP_Oral Contraceptives should display sub categories (New Users) or (Continuing Users).
There is no support for categories in charts. You can only get the totals for the data elements. It is actually the same also in GIS or Data Visualizer. The only places where data analysis on category level is supported is using data set reports (obviously), report tables/standard reports (use the report table type called Data Element Dimension Table), in excel pivots connected to mydatamart, and via the use of indicators you can display category-level data in all modules (cumbersome, but can be done).
This is why I am always preaching that the categories should be designed so that the total for the data element makes sense for data analysis, and not just to make the auto form look good.
Ola
In case this is any help, here is the URL on our local network copy. Using Version: 2.5 Build revision: 4982
If anyone tries to create a chart like this they will get a mix of apples and oranges.
Most of the other data element selection dialogs work correctly… eg in the GIS module, and when creating indicator definitions.
Has this bug been fixed?
Randy Wilson, Rwanda
Error! Filename not specified.
Mailing list: https://launchpad.net/~dhis2-users
Post to : dhis2-users@lists.launchpad.net
Unsubscribe : https://launchpad.net/~dhis2-users
More help : https://help.launchpad.net/ListHelp
In Rwanda we have been doing local installations of DHIS-live with the Postgres backend during the training of district data managers, this makes it easy for people to use the system off-line and when training 40 people it results in much better performance, particularly for the GIS module. I’m attaching the user guide we prepared in case any of you would like to build on it.
On most computers these instructions work fine, but we generally find about 20% of the computers where the Postgres installation fails. Users are unable to login to postgres following installation and dhis-live fails because the password in the hibernate file doesn’t work. Pgadmin prompts for a password, but it won’t accept the password entered during installation. Most of the laptops with problems are model HP 6530b – doesn’t seem to matter if they are XP pro, Vista or Windows 7. The strange think is that on many of these laptops the installation works fine – so I’m thinking it has more to do with the computer config – not the computer model number. We can’t just re-install postgres until we remove the postgres service account and all of the installed files. Usually we get the same issue when we try to reinstall.
Have others experienced this issue? I can’t find anything useful on the Postgres.org web site.
Thanks,
Randy Wilson, Rwanda
DHIS INSTALLATION.docx (796 KB)
From: olatitle@gmail.com [mailto:olatitle@gmail.com] On Behalf Of Ola Hodne Titlestad
Sent: Friday, November 18, 2011 10:55 AM
To: Wilson,Randy
Cc: dhis2-users
Subject: Re: [Dhis2-users] Problem with data element selection in Chart module
On 18 November 2011 09:25, Wilson,Randy rwilson@msh.org wrote:
I’m not sure if anyone noticed this yet, but the data element selection dialog for the chart module does not function correctly, it allows you to select data elements, but it does not display category combinations. In our case FP_Oral Contraceptives should display sub categories (New Users) or (Continuing Users).
There is no support for categories in charts. You can only get the totals for the data elements. It is actually the same also in GIS or Data Visualizer. The only places where data analysis on category level is supported is using data set reports (obviously), report tables/standard reports (use the report table type called Data Element Dimension Table), in excel pivots connected to mydatamart, and via the use of indicators you can display category-level data in all modules (cumbersome, but can be done).
This is why I am always preaching that the categories should be designed so that the total for the data element makes sense for data analysis, and not just to make the auto form look good.
Ola
In case this is any help, here is the URL on our local network copy. Using Version: 2.5 Build revision: 4982
If anyone tries to create a chart like this they will get a mix of apples and oranges.
Most of the other data element selection dialogs work correctly… eg in the GIS module, and when creating indicator definitions.
Has this bug been fixed?
Randy Wilson, Rwanda
Error! Filename not specified.
Mailing list: https://launchpad.net/~dhis2-users
Post to : dhis2-users@lists.launchpad.net
Unsubscribe : https://launchpad.net/~dhis2-users
More help : https://help.launchpad.net/ListHelp
Hi,
Have others experienced this issue? I can’t find anything useful on the Postgres.org web site.
Did you try the “show postgresql user” fix I emailed you when I was in Rwanda? You might have to unhide hidden users, and change the passord there. I think the most common reason for this to happen is when a user has an older version of postgres installed, and they have forgotten the password… (uninstalling doesn’t help)
Regards,
Morten
Thanks,
Randy Wilson, Rwanda
From: olatitle@gmail.com [mailto:olatitle@gmail.com] On Behalf Of Ola Hodne Titlestad
Sent: Friday, November 18, 2011 10:55 AM
To: Wilson,Randy
Cc: dhis2-users
Subject: Re: [Dhis2-users] Problem with data element selection in Chart module
On 18 November 2011 09:25, Wilson,Randy rwilson@msh.org wrote:
I’m not sure if anyone noticed this yet, but the data element selection dialog for the chart module does not function correctly, it allows you to select data elements, but it does not display category combinations. In our case FP_Oral Contraceptives should display sub categories (New Users) or (Continuing Users).
There is no support for categories in charts. You can only get the totals for the data elements. It is actually the same also in GIS or Data Visualizer. The only places where data analysis on category level is supported is using data set reports (obviously), report tables/standard reports (use the report table type called Data Element Dimension Table), in excel pivots connected to mydatamart, and via the use of indicators you can display category-level data in all modules (cumbersome, but can be done).
This is why I am always preaching that the categories should be designed so that the total for the data element makes sense for data analysis, and not just to make the auto form look good.
Ola
In case this is any help, here is the URL on our local network copy. Using Version: 2.5 Build revision: 4982
If anyone tries to create a chart like this they will get a mix of apples and oranges.
Most of the other data element selection dialogs work correctly… eg in the GIS module, and when creating indicator definitions.
Has this bug been fixed?
Randy Wilson, Rwanda
Error! Filename not specified.
Mailing list: https://launchpad.net/~dhis2-users
Post to : dhis2-users@lists.launchpad.net
Unsubscribe : https://launchpad.net/~dhis2-usersMore help : https://help.launchpad.net/ListHelp
Morten
Hi Randy,
including values from individual category options (not only totals) is on the plan both for the GIS and charts / data visualizer module, it will be there most likely for 2.7 release.
best regards,
Lars
On Fri, Nov 18, 2011 at 10:46 AM, Wilson,Randy rwilson@msh.org wrote:
Hi Ola,
Thanks for the quick reply. In this case I guess the only solution is to rely on the Indicator module and to create “data elements” as indicators of number type that reflect the needed categories.
Would it not be relatively simple to modify the chart and GIS modules so that they pull from the data element category combo boxes in the Indicator definition dialogs? Is this in a blueprint somewhere?
Randy Wilson
From: olatitle@gmail.com [mailto:olatitle@gmail.com] On Behalf Of Ola Hodne Titlestad
Sent: Friday, November 18, 2011 10:55 AM
To: Wilson,Randy
Cc: dhis2-users
Subject: Re: [Dhis2-users] Problem with data element selection in Chart module
On 18 November 2011 09:25, Wilson,Randy rwilson@msh.org wrote:
I’m not sure if anyone noticed this yet, but the data element selection dialog for the chart module does not function correctly, it allows you to select data elements, but it does not display category combinations. In our case FP_Oral Contraceptives should display sub categories (New Users) or (Continuing Users).
There is no support for categories in charts. You can only get the totals for the data elements. It is actually the same also in GIS or Data Visualizer. The only places where data analysis on category level is supported is using data set reports (obviously), report tables/standard reports (use the report table type called Data Element Dimension Table), in excel pivots connected to mydatamart, and via the use of indicators you can display category-level data in all modules (cumbersome, but can be done).
This is why I am always preaching that the categories should be designed so that the total for the data element makes sense for data analysis, and not just to make the auto form look good.
Ola
In case this is any help, here is the URL on our local network copy. Using Version: 2.5 Build revision: 4982
If anyone tries to create a chart like this they will get a mix of apples and oranges.
Most of the other data element selection dialogs work correctly… eg in the GIS module, and when creating indicator definitions.
Has this bug been fixed?
Randy Wilson, Rwanda
Error! Filename not specified.
Mailing list: https://launchpad.net/~dhis2-users
Post to : dhis2-users@lists.launchpad.net
Unsubscribe : https://launchpad.net/~dhis2-usersMore help : https://help.launchpad.net/ListHelp
Mailing list: https://launchpad.net/~dhis2-users
Post to : dhis2-users@lists.launchpad.net
Unsubscribe : https://launchpad.net/~dhis2-users
More help : https://help.launchpad.net/ListHelp