By Hassan Muhomi (@muhomis) and Rajabu Mkomwa (@rajab_mkomwa)
1. Introduction
1.1. Background
Malaria is one of the world’s most dangerous endemic diseases, caused by a Plasmodium parasite and spread by a female Anopheles mosquito. Malaria, despite being preventable and treatable, continues to have a devastating impact on people’s health and livelihoods worldwide. According to the World Health Organization (WHO), at least 627,000 people died from Malaria in 2020, with Africa accounting for 95% of all Malaria cases and 96% of Malaria deaths (Malaria (who.int)) . Children under the age of five are the most vulnerable. Tanzania, one of the African countries south of the desert, is one of those affected by the disease.
The Ministry of Health (MoH), through the National Malaria Control Programme (NMCP), has been conducting interventions to reduce and eliminate malaria in Tanzania in collaboration with stakeholders such as the Research Triangle Institute (RTI), SWISS PTH (TEMT), Ifakara Health Institute (IHI), and National Institute for Medical Research (NIMR), to name a few. Following the implementation of DHIS2 as the national Health Management Information System (HMIS) and the satisfactory reporting of routine service data from public and private healthcare facilities, the consolidation and presentation of information in a single location to allow health managers and stakeholders at various levels to easily access, analyze, interpret, and act appeared critical. This, combined with WHO dashboard requirements, prompted the Ministry of Health (MoH), in collaboration with the University of Dar es Salaam (UDSM) DHIS2 lab and Malaria stakeholders, to develop a Malaria dashboard application installable in HMIS-DHIS2 to meet the program’s needs, some of which were not met by the existing DHIS2 version in use.
1.2. Challenges experienced before implementation of Malaria dashboard
Because Malaria data is obtained from various service departments such as Outpatient Department (OPD), Inpatient Department (IPD), Dispensing, Laboratory, and so on, as well as events such as death; program managers, stakeholders, and users at the national and subnational levels lacked a common tool for visualizing, monitoring, discussion, and analysis. This resulted in discordant indicator definitions (some of which used data elements while others used indicators, etc.), a lack of flexibility in presenting Malaria data for different months of different years on the same chart to compare trends, and an inability to visualize data for indicators that cannot be configured through DHIS2 maintenance, to name a few. Due to these limitations, Malaria stakeholders were forced to extract data from HMIS-DHIS2 in order to plot visualizations offline.
2. The Implementation Method
In 2017, NMCP in collaboration with stakeholders consulted the UDSM DHIS2 lab to develop a Malaria dashboard that will be used by users at different levels and stakeholders to visualize, analyze, monitor, and discuss malaria agenda towards reducing the burden of the disease. The MoH through NMCP held a number of meetings with stakeholders to harmonize the set of indicators that will benefit all involved stakeholders to avoid seeking different data sets from the same teams at lower levels. On indicator matrices with standard indicator names, definition, short name, description, and source of numerators and denominators, agreement was reached. The list also includes each visualization’s unique identifier, favorite name, and type of visualization to help control the changes that can be made on one of the listed variables for consistency. The team (MoH, stakeholders, and UDSM DHIS2 Lab) organized charts by service departments (OPD, IPD, Malaria testing, Malaria dispensing, RCH, commodities, deaths, and so on) to make it easier for users to find the type of chart they want. The charts were further classified within each service department: for example, Malaria death is further classified into total malaria deaths, Malaria deaths burden and incidence, and case fatality rate; allowing users to easily access the type of chart they require.
For each chart, agreement was reached on the type of visualization (e.g., linear, bar graph, map, etc.), chart colors, and chart layout. MoH and stakeholders plotted the charts with other tools, stamped them on paper, and presented them to the UDSM DHIS2 team to mimic the dashboard presentation (Figure 1).
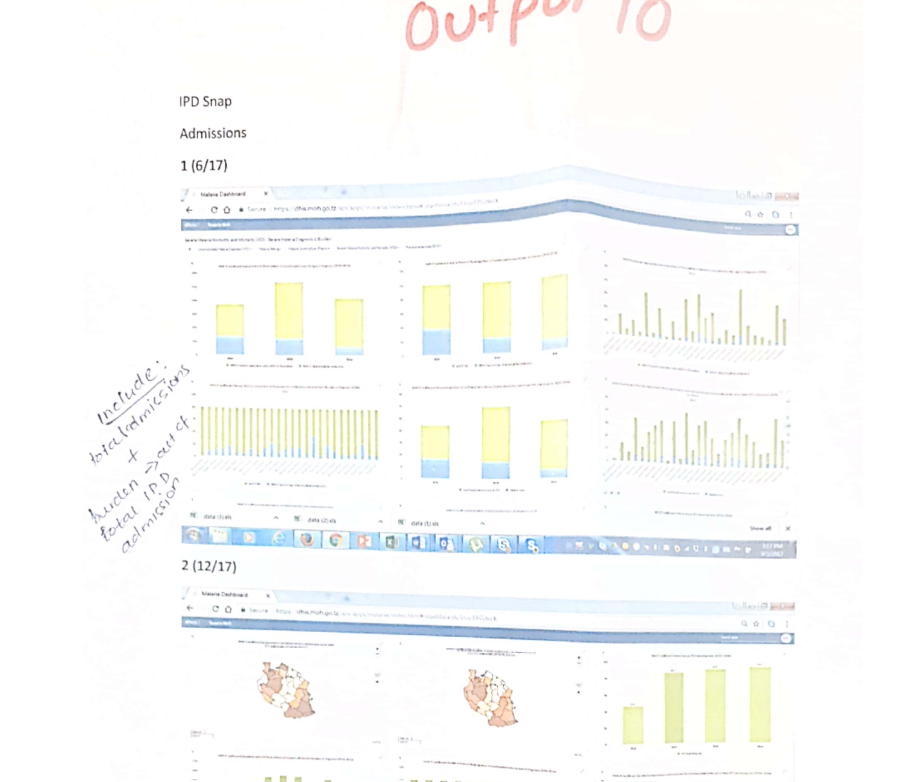
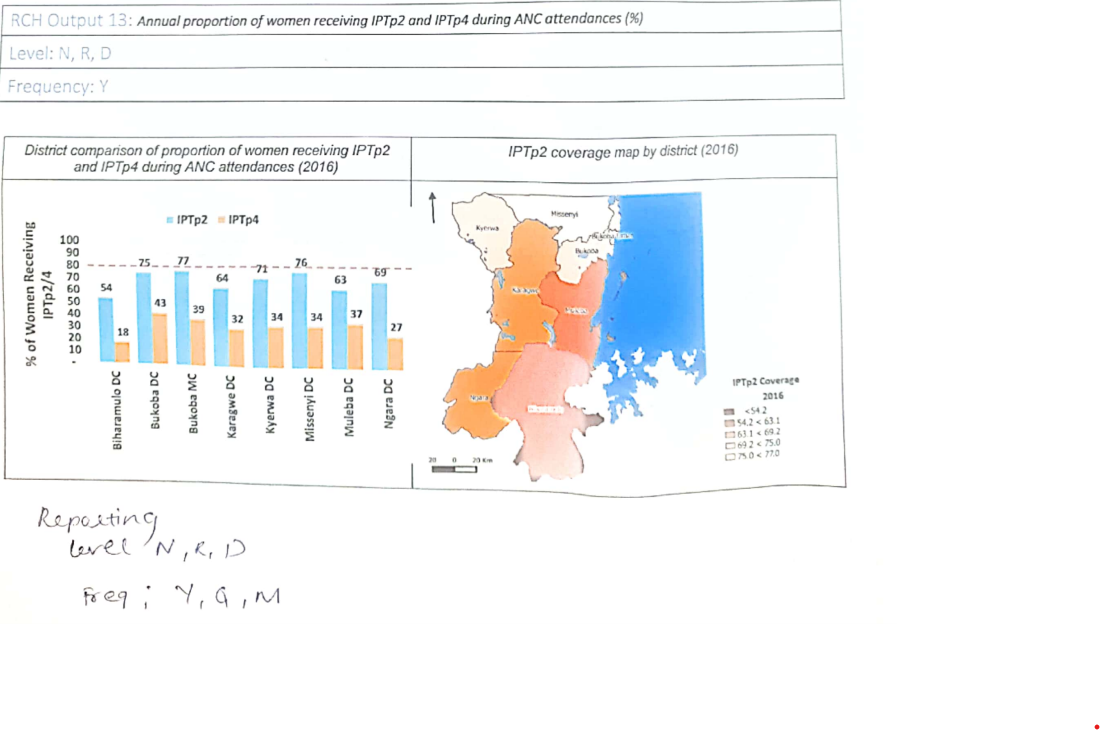
Figure 1: Printout samples from the Ministry of Health and stakeholders for use in the Malaria dashboard within DHIS2 (source: client specifications).
While the DHIS2 version in use at the time had limitations on presenting the chart that shows data from different months and years (Figure 2), the client (MoH Tanzania) requested a dashboard that would provide that. The UDSM DHIS2 lab reported this to the HISP center in order for the dashboard to offer such flexibility, and while waiting for the request to be prioritized, the MoH continued to push for the deliverable as per the TOR. This pushed the UDSM DHIS2 team to come up with local innovation to address local needs, such as developing the interactive dashboard as an application installable on DHIS2, leveraging the power of DHIS2. The Malaria dashboard application provides the ability to present charts with different custom colors of choices as requested by the client (Figure 3), a feature not available on the previous DHIS2 dashboard.
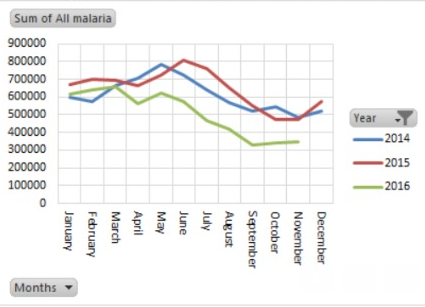
Figure 2: An example of the type of malaria data visualization requested by the MoH (source: client specifications)
3. Benefits of Malaria dashboard implementation within HMIS-DHIS2 in Tanzania
The implementation of the malaria dashboard in Tanzania aided the MoH’s NMCP in bringing all malaria stakeholders and users together to define, decide, and standardize the indicator matrix and the way it is controlled, which requires mutual consensus before changing any visualization or indicator. In summary, the dashboard produced the following results:
3.1. Standardized and categorically presentation of Malaria data
The dashboard displays agreed-upon malaria data in a way that users and stakeholders at various levels can access from a single tab (Figure 3). The visualizations are organized in such a way that it is simple for the ministry and users at subnational levels to analyze and follow up on data that does not make sense. This has stimulated the use of data, particularly malaria data, through the daily sharing of charts via WhatsApp groups of malaria coordinators at the district, regional, and national levels to share best practices and challenge any anomalies discovered.
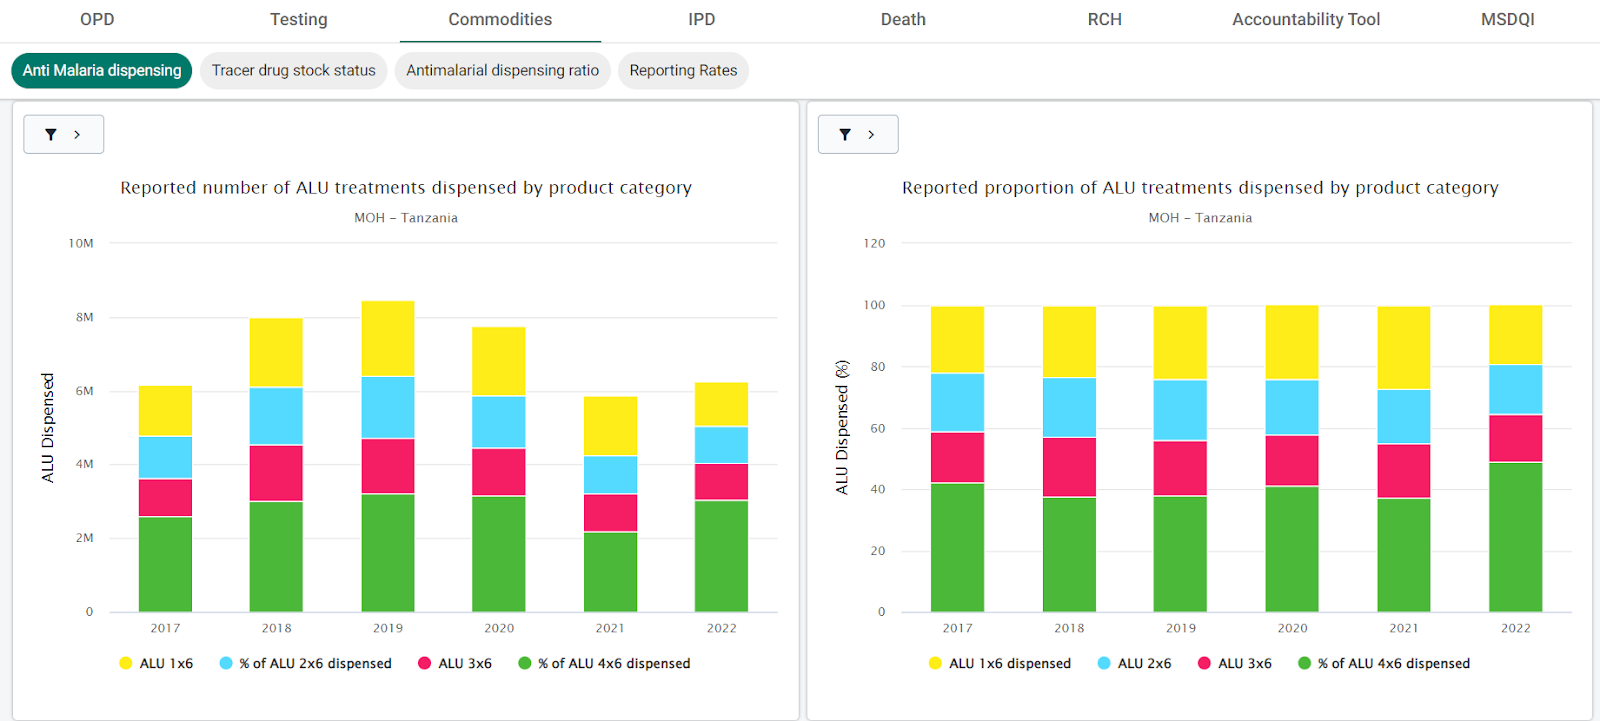
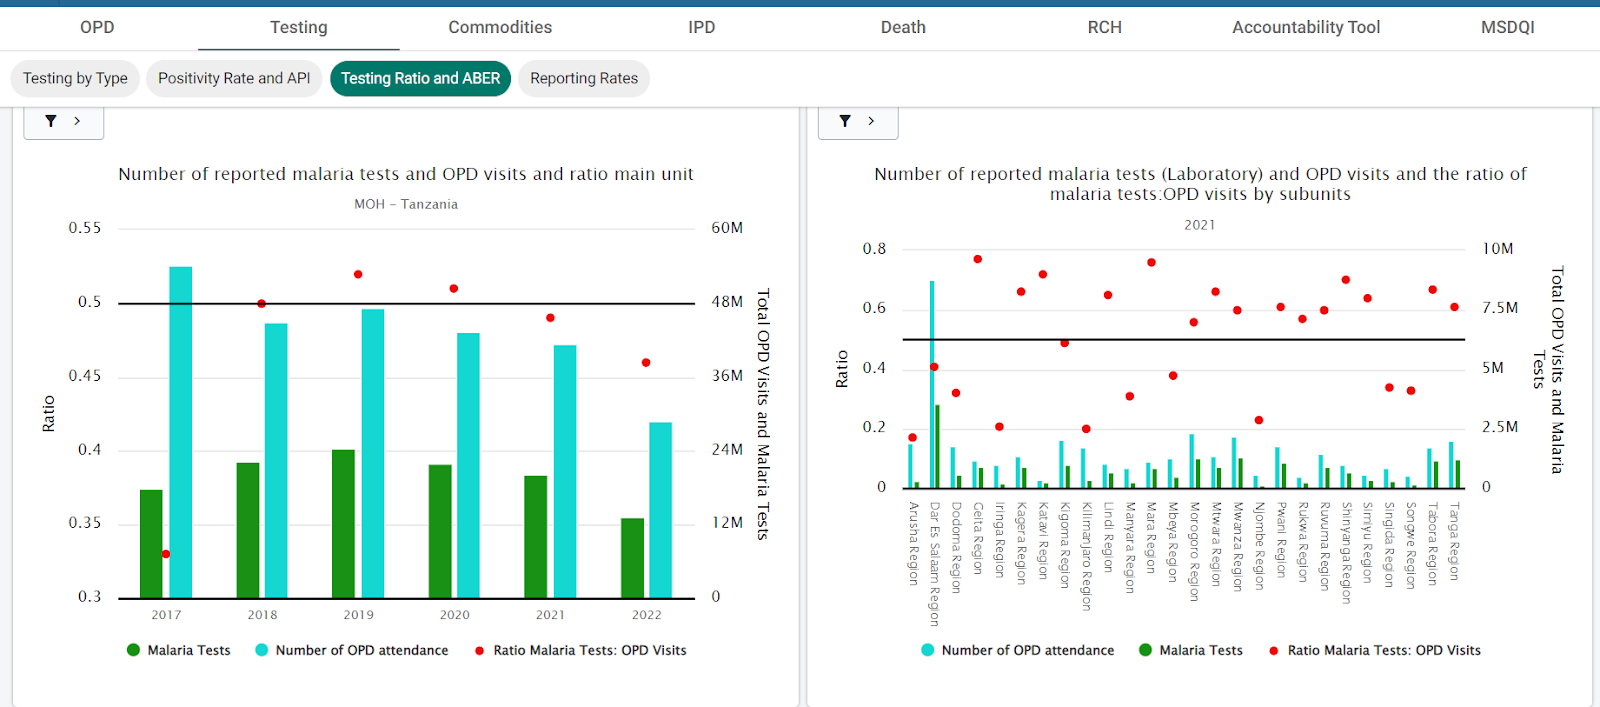
Figure 3: Presentation and categorization of visualizations from Malaria dashboard in Tanzania (source: HMIS-DHIS2).
3.2. The Malaria Dashboard is the focal point of the Malaria Agenda Meeting
For any malaria meeting involving NMCP and lower-level users or stakeholders, the malaria dashboard has been a reliable tool to inform them about the disease burden, compliance with malaria management guidelines, success and challenges of intervention at various locations, as indicated by visualizations from reported routine data, so that joint efforts can be directed to the neediest areas. This is especially important in a situation like Tanzania, where different implementing partners are assisting different parts of the country in combating the disease. One of the notable achievements toward a common understanding of the disease’s status is the availability of a tool that serves as a reference for all stakeholders and implementing partners to discuss and plan with the MOH’s NMCP about malaria prevention, treatment, reporting, and dissemination (Figure 4).
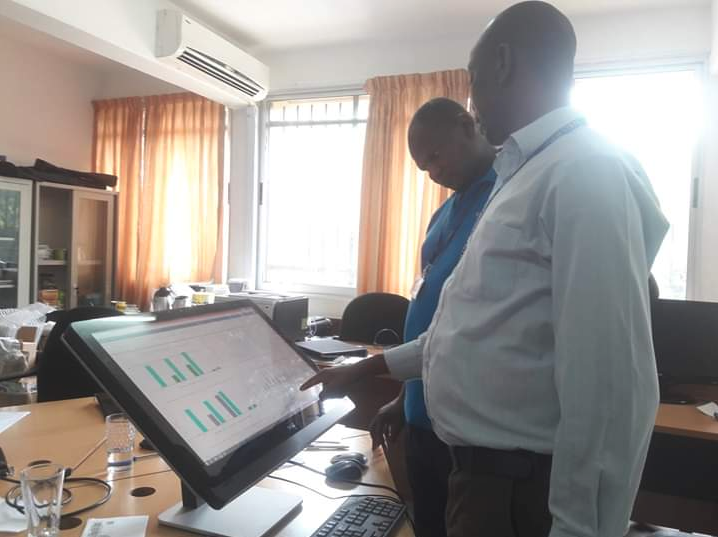
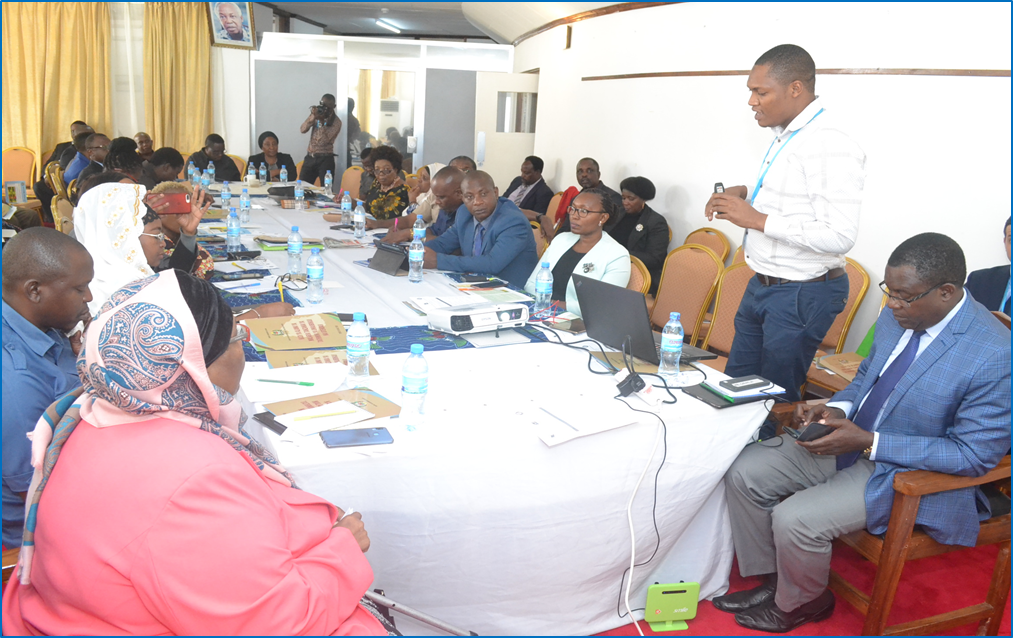
Figure 4: Making sense of malaria data presented in the malaria dashboard, as well as a stakeholder meeting with the malaria dashboard on the agenda.
3.3. Preparation of Malaria bulletin
The MOH’s NMCP has been developing a semi-annual and annual malaria bulletin in collaboration with development and implementing partners to provide a quick and simplified highlight of the progress made toward achieving the NMCP strategic goal of reducing malaria prevalence to less than 3.5% by 2025 and eliminating the disease by 2030. Malaria dashboard has been a reliable tool in the development of the malaria bulletin for accessing routine data for the bulletin (Figure 5). The presence of categorically aligned data presentations by various service departments, as well as the comparison and contrast of related indicators, has made the exercise simple, enjoyable, and chronologically performed.
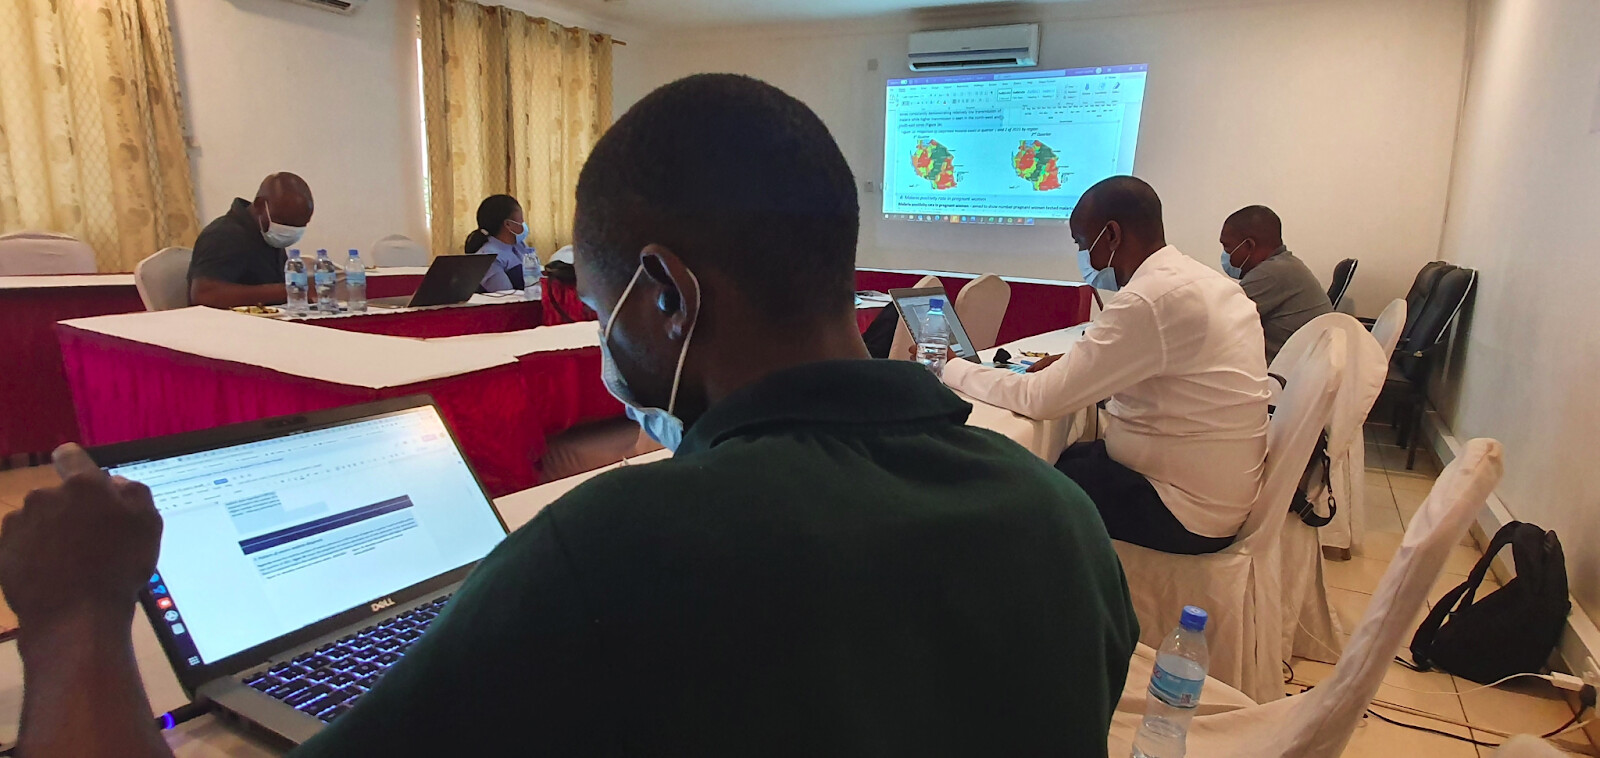
Figure 5: Malaria stakeholders’ meeting to develop malaria bulletin using malaria dashboard data and data from other sources.
3.4. The development of an interactive dashboard to meet local needs benefited the DHS2 global community.
As more countries using DHIS2 continued to present use cases requiring solutions similar to those provided by the interactive dashboard in the malaria dashboard application, the DHIS2 core team prioritized the task and released the version that includes the default dashboard that serves the use cases presented. The DHIS2 dashboard has been interactive since that version’s release, allowing users to drill down to visualize the same visualization in lower-level units, filter by different periods, facility types, ownership, and so on, and switch between different output types (Figure 6).
Nonetheless, the malaria dashboard may reveal more information to the core DHIS2 team. Specifically, following the Malaria Surveillance framework, dashboards have been grouped into different service categories, and the Malaria dashboard has been tailored to present the same in order to simplify focused analysis around the said categories. Furthermore, the Malaria composite dashboard version of the malaria dashboard for analysis of non-health facility data has been subdivided into categories and subcategories.
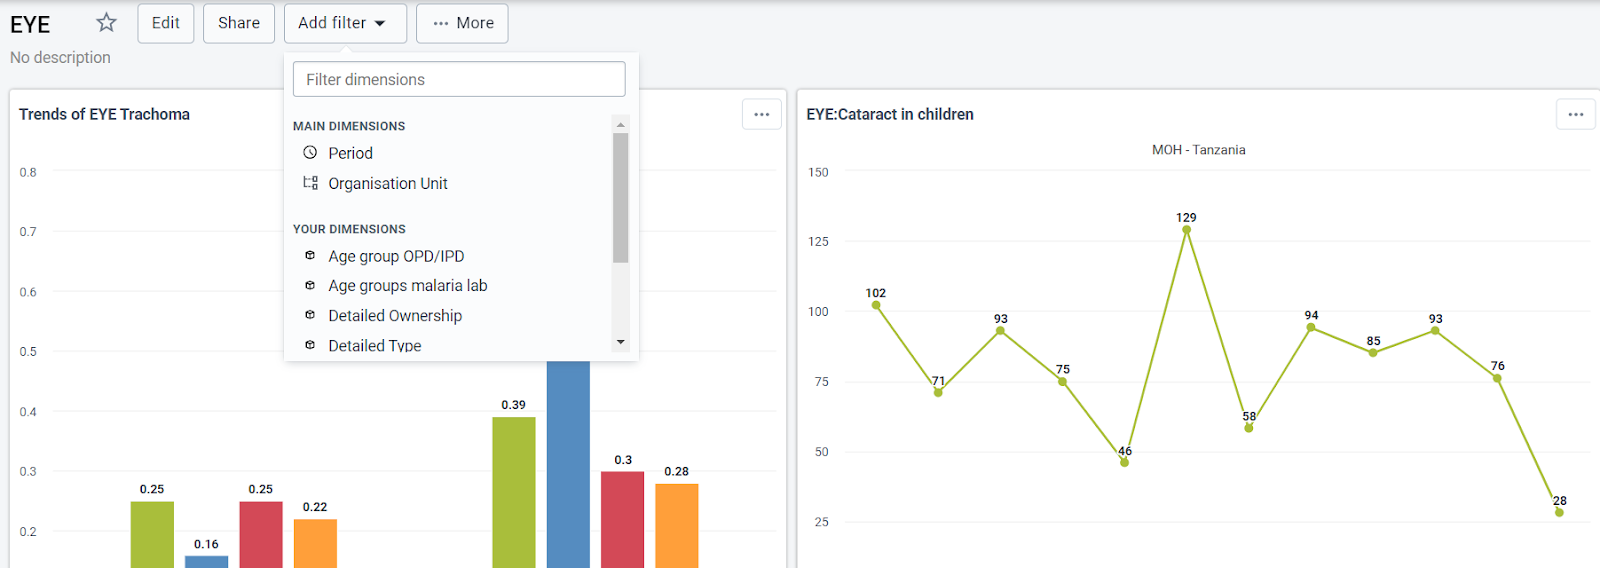
Figure 7: Flexibility offered by DHIS2 dashboard in recent versions.
4. Way forward
Finally, the flexibility and freedom given to country’s local teams to use DHIS2 API to develop custom applications to solve the country’s use cases, and later on the experience shared with the DHIS2 community, have been among the factors that fuel the improvement of the DHIS2 platform to fit and preferable in implementation of many countries’ health information systems, and now implementation including non-health domain. To meet the growing demand for more custom-tailored implementations, local teams must be given more authority to modify their implementations’ interfaces. For example, developers working on tracker-based solutions must be given the freedom to design solutions with user interfaces tailored to the specific use case while being powered by the DHIS2 tracker API and taking advantage of DHIS2’s rich analysis power.