Version 1.5.0 of DHIS2 Climate App – with support for additional rainfall data – is now available on DHIS2 App Hub. You can install or upgrade the app under App Management for your DHIS2 instance. The app is supported for DHIS2 version 2.37 and above.
In addition to the ERA5-Land dataset you can now import precipitation data for your organisation unit from the CHIRPS dataset. This is a high-resolution (approx 5 km at the equator) rainfall dataset that combines ground-based weather station data with satellite data to provide accurate estimates of precipitation. It is designed to monitor and analyze precipitation patterns across regions, especially in areas where station data might be sparse or unreliable. CHIRPS is produced by the Climate Hazard Center at University of California, Santa Barbara with support from USAID, NASA, and NOAA.
CHIRPS is widely used to monitor drought conditions. Farmers and agricultural planners use CHIRPS data to track rainfall patterns and plan for planting and harvesting seasons. With daily precipitation records from 1981 it can show how precipitation patterns are changing due to climate change. It is also used in flood forecasting, disaster risk reduction, and humanitarian aid planning in areas that are vulnerable to extreme weather events.
In the DHIS2 Climate App you have the option to import precipitation from both ERA5-Land the CHIRPS dataset. Here is a comparison of the two datasets:
| ERA5-Land | CHIRPS | |
|---|---|---|
| Coverage | Global | 50°S - 50°N |
| Spatial resolution | 0.1° (approx. 9 km) | 0.05° (approx. 5 km) |
| Temporal resolution | Hourly | Daily |
| Period | 1950 - near-present | 1981 - near-present |
| Variables | 50 variables | Only precipitation |
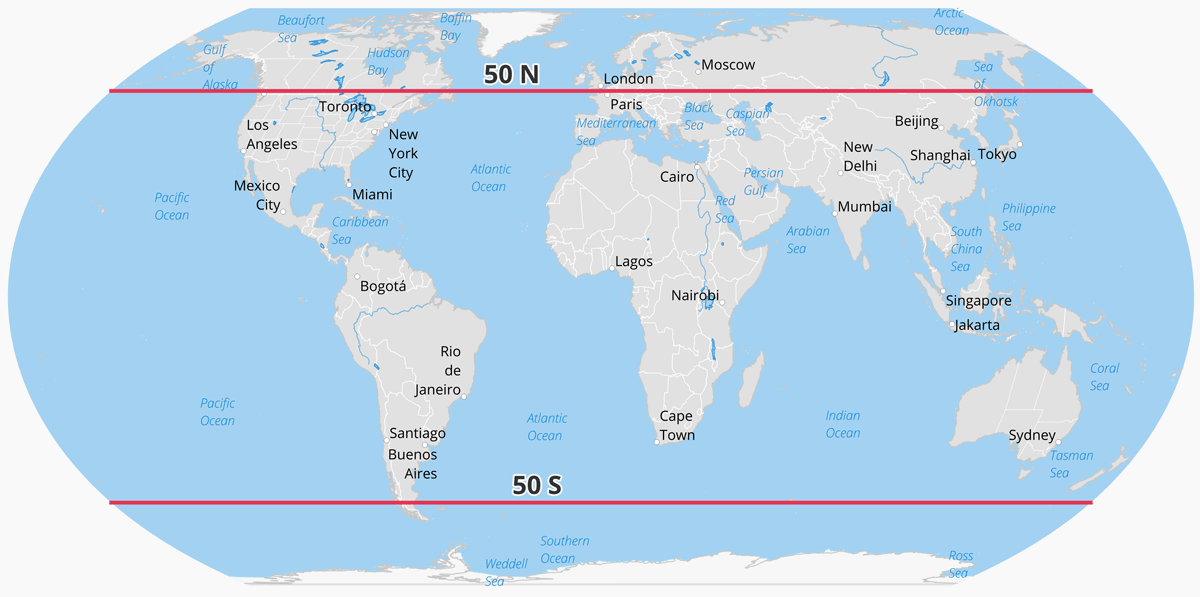
CHIRPS has a higher resolution than ERA5-Land, but it does not cover regions above 50°N or below 50°S:
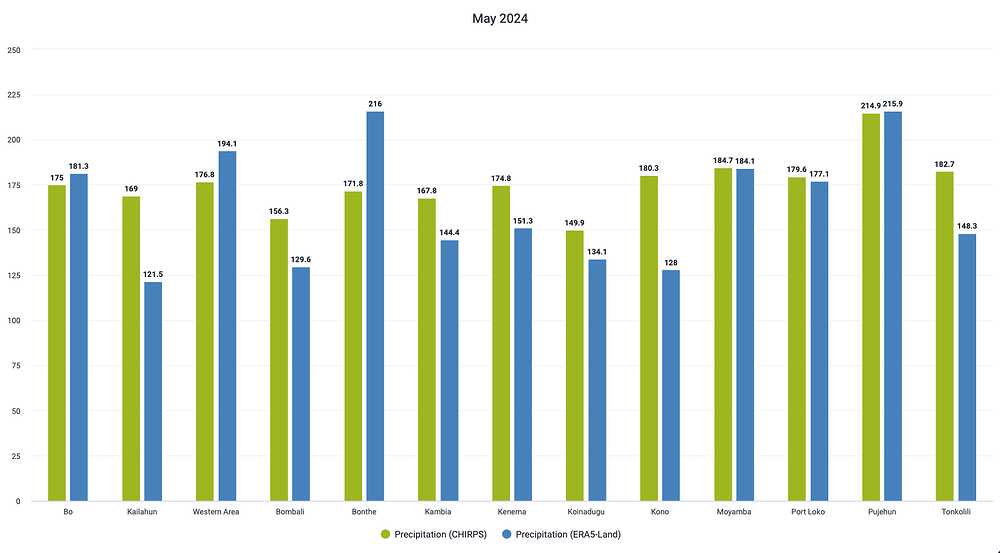
You can easily use the Climate App to import both datasets and then use Data Visualizer App to compare the precipitation data for your organisation units. Here is a comparison for different districts in Sierra Leone for May 2024.
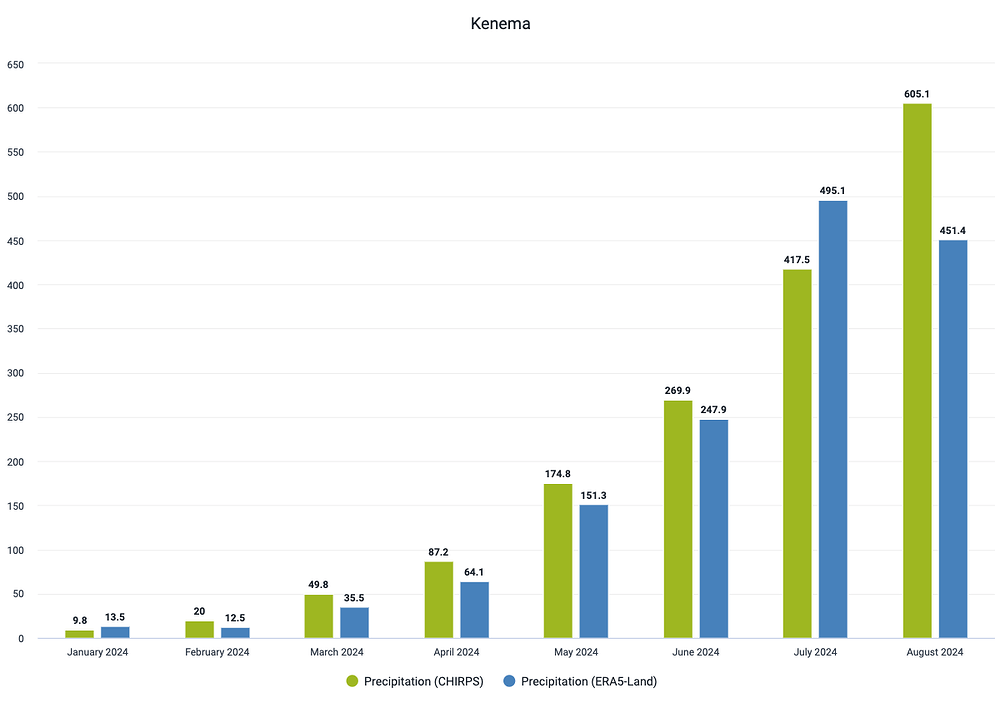
This chart compares monthly values from CHIRPS and ERA5-Land for Kenema district in Sierra Leone from January to August this year.
Which dataset should you use? Having multiple sources to choose from is important, especially in areas where weather station data is limited. There are several research papers comparing weather and climate data sources for different regions (example for Ethiopia). Ask for advice from the meteorological office in your country. Both data sources (and more underway) can be assessed with CHAP (Climate Health Analytics Platform).


