Hi all,
DHIS2 version 2.32 is out with many new features, apps, improvements and bug fixes.
Log in with admin / district on the demo server. Right-click on the links to open in new tab.
ANALYTICS FEATURES
Dashboard filter: The dashboard app now provides filters which apply to entire dashboards. You can filter the dashboard content by most available dimensions. This is powerful as it combines the usefulness of filters with the ability of dashboards to see all of your most important metrics at a glance. You can click “Add filter” above the dashboard to open the list of filters. If the selected filter exists as a dimension in a dashboard item, the dimension will be replaced; otherwise the filter will be added to the dashboard item as a new filter. Try it out in the demo e.g. by selecting “Facility type” as filter.
Demo | Screenshot 1 | 2 | 3 | Docs
Dual-axis charts: You can now build a chart with two axes. This is useful for creating charts which combine percentage indicators, like coverage rates or data set reporting rates, and data element numbers, like total number of visits.
Demo | Screenshot 1 | 2 | Docs | Jira
Tracked entity instance relationships in maps: Now tracked entity instances and their relationships can be shown in the maps application. This is a useful feature, for example, to display relationships between an index case of malaria and the corresponding introduced cases.
Screenshot 1 | 2 | 3 | Docs | Jira
Event polygons in maps: The maps application can now show event polygons or shapes. Buffers can also be applied to the event polygons. This is very useful with defining a focus or investigation area and associating it with other tracked entity instances such as Malaria cases, for example.
Screenshot 1 | 2 | Docs | Jira
Optimized layout for pie and gauge charts: The gauge and pie chart layout now offer only series and filter available for selection. Category has been removed because it was not applicable in order to build these charts.
Demo | Screenshot | Jira
Multiple filters in maps: The maps app now allows you to specify any number of filters. This allows for a more focused analysis and makes the maps app equally flexible as the visualizer and pivot apps in this regard.
Demo | Screenshot 1 | 2 | Docs
Progressive dashboard loading: This version offers a dramatic performance improvement for users that have dashboards with many items through progressive dashboard loading. This means the items which are visible in the viewport are loaded first, and then other items are loaded progressively as the user scrolls down the dashboard page.
Rich text in text dashboard items: Good dashboards tell a story, and one of the best ways to communicate on a dashboard are through text items. We have now included rich text in the dashboard text item so users can use bold and italics to catch the readers’ attention.
Demo | Screenshot | Jira
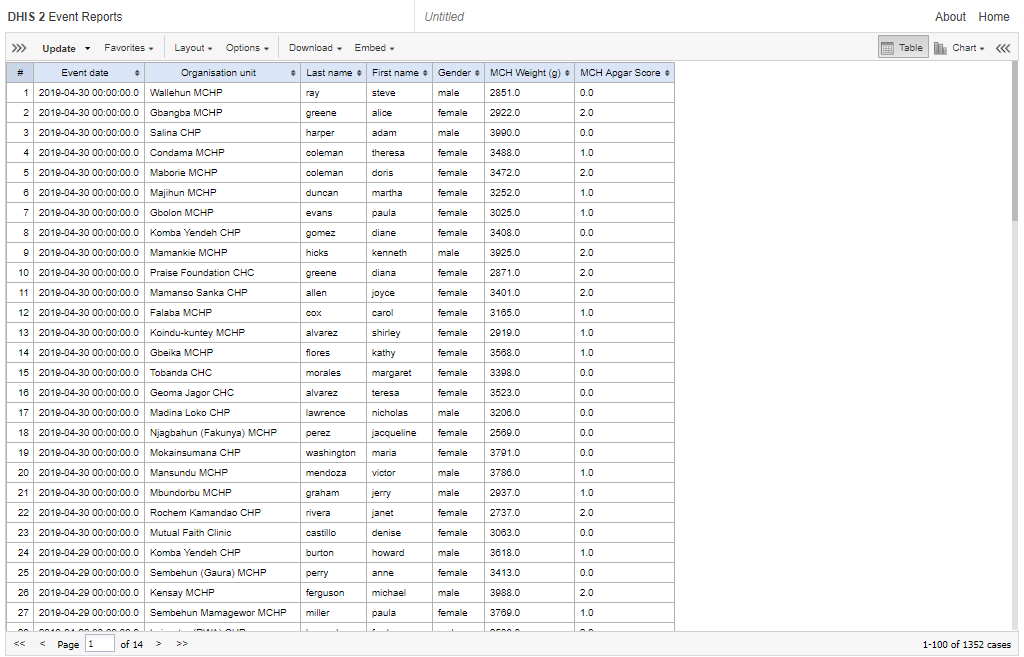
Events sorted in descending date order: In event reports now all events are listed in descending order starting with the most recent at the top.
Demo | Screenshot | Jira
Rich text in interpretation panels: The interpretation panels across all apps now support rich text (emoticons, bold, and italics) in the interpretations drop down in the dashboard application and the interpretations right panel in the other analytics applications. This will help improve the effectiveness of the communication between users about their data. In the new analytics applications (dashboards and data visualizer) there are new rich text buttons.
Demo | Screenshot 1 | 2 | Jira
Reporting rate aggregation across multiple filter periods: Previously when viewing reporting rates across multiple filter periods, the number of expected reports would not aggregate properly. This would often produce a reporting rate that was incorrectly high. This has been corrected so that the expected reports aggregates across filter periods and the corresponding reporting rate is calculated properly.
Demo | Screenshot | Jira
Server-side analytics cache: To improve performance of analytics request while at the same time ensuring security, a server-side cache for analytics requests have been added. This is helpful as the cached results are served behind the authentication and security layer of DHIS 2. You can enable it and specify the cache expiration time in seconds by adding a analytics.cache.expiration property to dhis.conf.
Stability: 18 bugs and issues related to analytics have been fixed in this release. This includes proper totals in pivot tables, proper aggregation of financial year data over time, no restriction on the number of options when searching for options in event reports, “open chart as map” in data visualizer, better performance when suggesting users to mentions in pivot tables.
Jira 1 | Jira 2 | Jira 3 | Jira 4
TRACKER AND EVENT FEATURES
FHIR adapter: The DHIS2 FHIR Adaptor was created to enable the import and export of clinical data using a rule engine that transforms patient-related clinical data from questionnaire-like structures (i.e. DHIS2 Tracker Programs and their Program Stages). It is optimized for national FHIR profiles that are based on standard coding systems like LOINC, SNOMED CT, CVX or even national coding systems.
Screenshot | Demo | Docs
User assignment for events: Program Stages can be configured to allow assignment to users, meaning that an event can be assigned to an individual. The assigned user will appear in the form in Tracker Capture.
Screenshot | Docs | Jira
Bidirectional relationships: It is now possible to designate a relationship to be bidirectional, allowing the relationship to be visible from both related entities and displayed in a widget. Descriptive names explaining the relation from both sides can be applied.
Screenshot | Demo | Docs | Jira
Event relationships from Capture app: It is now possible to add relationships between events and tracked entity instances. When adding or editing event it is possible to link to existing tracked entity instances, or create new ones to link to. This is useful when event programs is used to capture data that somehow is related to tracker data. For example when adding single events that will later be linked to a tracked entity instance.
Screenshots 1 | 2 | 3 | 4 | Demo | Docs | Jira
Program indicators for counting org units: It is now possible to create program indicators that counts organisation units. The indicators will be based on the presence of one or more enrollments or events that matches the filter criteria in that org unit. As an example, it is now possible to count the number of facilities that delivered a certain service.
Tracked entity attribute form name: You can now assign a form name to tracked entity attributes. The form name, similar to data elements, will be visualized in your data entry form in tracker capture, the new Capture App, and the Android App.
Screenshot | Docs | Jira
Z-score calculation: Using program rules, it is now possible to calculate z-score based on data provided by WHO weight-for-age indicators, using the function d2:zScoreWFA. The zScore can be automatically assigned to a field in the form or shown for reference with a program rule action that displays information to the user. The z-Score calculation is supported on all clients and for server side program rules.
Screenshot | Docs | Jira
Program rule health analysis: Integrity checks now identify program rules with faulty configurations, and summarizes any problems localized in the report. The integrity checks can be found under Apps > Data administration > Integrity checks.
Screenshot | Docs | Jira
Stability and performance: 21 tracker-related bugs and performance issues were addressed in this release. This includes significant improvements to API calls; program indicators and rules; relationship handling; and messaging.
APPS FEATURES
New Reports app: A new reports app has been created with modern web technologies to improve the user experience. This app is in beta. A new approval app is planned for 2.33 which will replace the current approval UI found in the previous reports app. As this app is in Beta, it exists alongside the existing app. If you wish to try it out, be sure to include the new app Reports app (Beta) in the list of apps accessible for the users/roles. You can remove access to the old Report app, but you will need to keep access if you need to make use of the data approval feature.
Docs | JIRA | Screenshot
New Usage Analytics app: The usage analytics app has had a make-over to bring it inline with the modern application style of DHIS 2.
Docs | JIRA | Screenshot
Icons and colors for program indicators & indicators: You now have the ability to associate icons and colours to Indicators and program indicators. They will be used in future versions of DHIS2 to display Feedback area of the Tracked Entity Dashboard or Event data capture in both web and Android.
Screenshot 1 | 2 | Jira | Docs
Download metadata in maintenance: The maintenance app now lets you download the current selection of object lists as JSON, XML and CSV. You can decide to download the content compressed or uncompressed, and with or without metadata sharing info. Click on the “gear” icon in the top-right corner of the maintenance object list page and select “Download” to try it out.
Demo | Screenshot | Jira
Skip zeros in analytics tables: A new system setting “Skip zero data values in analytics tables” is available under the “analytics” section in the settings app. This setting will dramatically improve performance of both analytics table generation and analytics queries if the database contains a lot of zero data values.
Edit legend set: Several issues with the “edit legend set” screen in the maintenance app have been fixed, and legend items are now sorted ascending by start and end value, the auto-generate legend items work properly and legends can be saved successfully.
Skip sharing in metadata dependency export: In the “metadata dependency export” section in the import-export app there is now an option for skipping sharing information as part of the export payload.
API FEATURES
API for line-listing of enrollments: A new API is added for line listing enrollments at /analytics/enrollments/query. The new endpoint makes it possible to retrieve data from several program stages for each enrollment, and produces one line per enrollment. This is useful when exporting enrollment data for use in other software, or when producing reports that span more than one program stage. When line-listing an enrollment that contains repeatable program stages, the event with the latest event date is used.
Org unit analytics API: A new endpoint for org unit analytics is now available. This endpoint provides statistics on org units classified by org unit group sets, i.e. counts of org units per org unit group within org unit group sets.
Skip audit in data value import: A new setting for the data value set import API is available for skipping the generation of audit values is now available. This is useful for very large imports and for data integration jobs where greater performance and reduced database size is a good trade-off for auditability. Enable it by specifying the skipAudit=true query parameter.
RELEASE INFO
| Release Information | Link |
|---|---|
| Download release and sample database | Downloads - DHIS2 |
| Documentation and Javadocs | Resources - DHIS2 |
| Upgrade notes | Upgrade notes for 2.32 on GitHub |
| Details about each feature on JIRA (requires login) | Issue navigator - Jira |
| Overview of bugs fixed on JIRA (requires login) | Issue navigator - Jira |
| Source code on Github | DHIS2 · GitHub |
| Demo instance | https://play.dhis2.org/2.32/ |
| DHIS 2 community | https://community.dhis2.org/ |