Hello DHIS2 community.
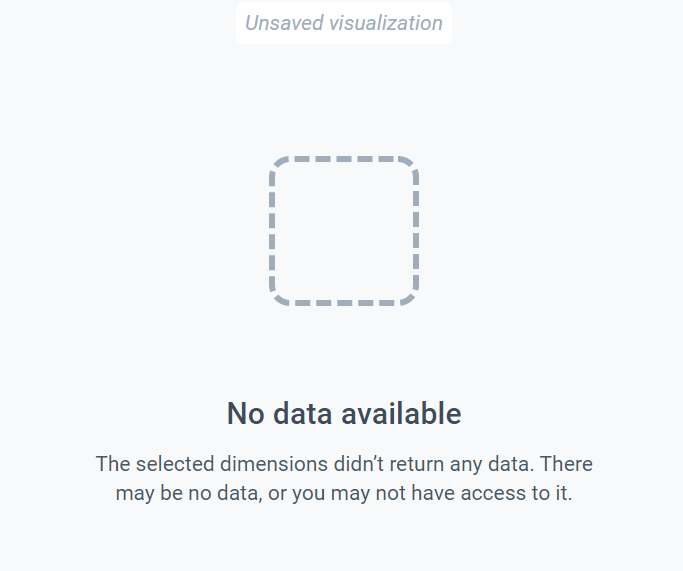
I am Dr Dan Djari Harouna, computer scientist in charge of setting up a dhis2 server with version 2.38.2.1 as part of a project on value chains. We were able to deploy the platform via our host with service option. Thus we proceeded to the installation of the platform until the visualization. At this level, it is not possible to visualize the graphs the analysis of the tables has been carried out without errors. After generating a graph, the server displays "No data available
The selected dimensions didn’t return any data. There may be no data, or you may not have access to it. "
In addition, network analysis via the browser "…
39.44289107.chunk.js:sourcemap:2 The query should be static, don’t create it within the render loop!
(anonymous)@139.44289107.chunk.js:sourcemap:2
139.44289107.chunk.js:sourcemap:2 @TODO: Why does this component unmount after a force reload?
(anonymous)@139.44289107.chunk.js:sourcemap:2
139.44289107.chunk.js:sourcemap:2 The query should be static, don’t create it within the render loop!
(anonymous)@139.44289107.chunk.js:sourcemap:2
139.44289107.chunk.js:sourcemap:2 @TODO: Why does this component unmount after a force reload? …
After installation, I suppose you have imported some data(TEI’s/enrollments etc) in to your system, and created program indicators?
For data to be available in data visualizer you have to run analytics.
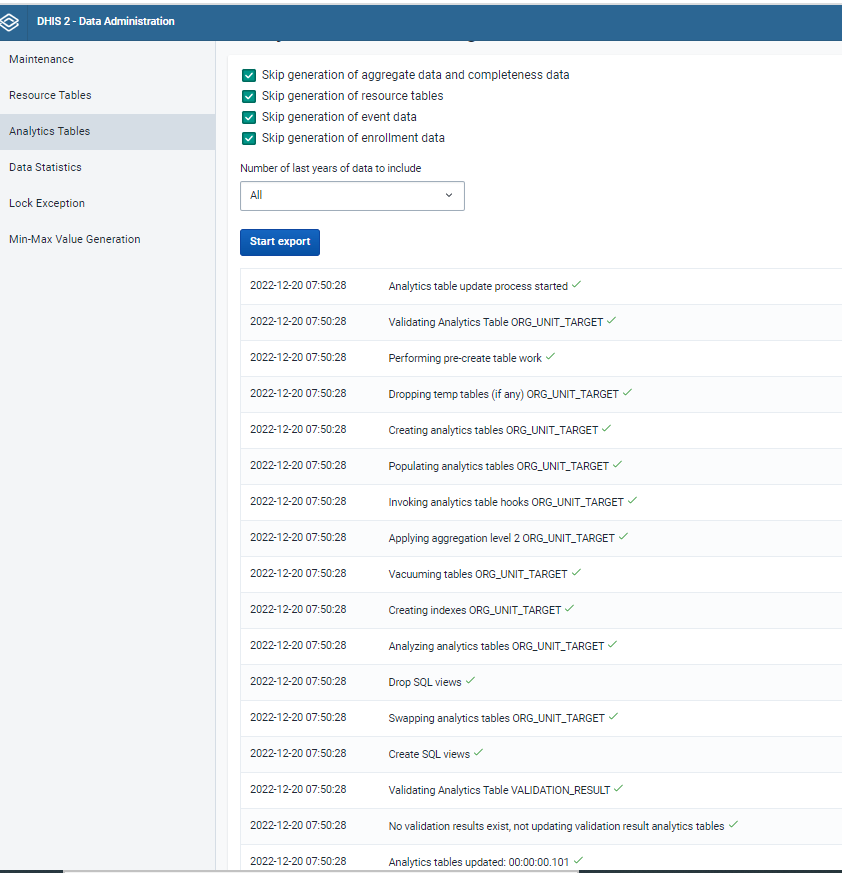
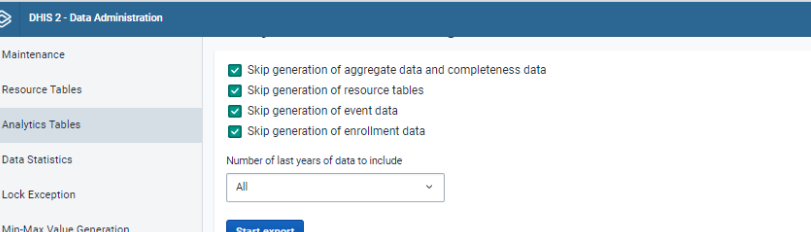
Open the data administration app, select analytics tables, and start export. Wait for it to finish, might take a couple of minutes if you have a lot of data in the system.
Try data visualizer again to see if you get data now.
If you want this to run automatic, it can be configured in the scheduler app:
Open the scheduler app
Add a new job
Create a name for the job, and select analytics tables as job type
Choose preset times by clicking on the button for preset times.
Select how many years back to update, and if you want to skip some table types.
Thanks Caroline for your reply. YES, indeed we imported metadata but without the data. At the moment we only have data elements.
We have run the analyzes several times and no errors are detected. We manage to see the data entered via the report but the graphs are not displayed, we always get no
"No data available
The selected dimensions didn’t return any data. There may be no data, or you may not have access to it. "
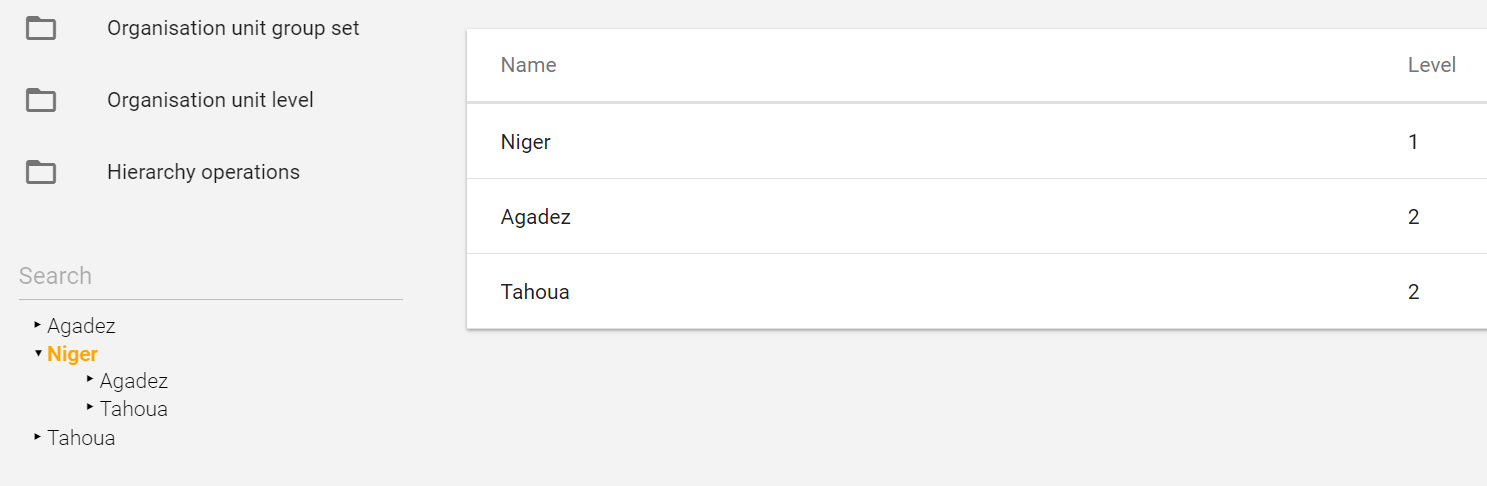
in relation to my data visualization problem, I suspect my Organization unit management of my units. Below is their structure. I would like to know if this is the problem. If so how to fix this problem because I can’t delete them as data has been entered. thank you
Happy new year and apologies for the late feedback here.
But as I can see in your screenshot, you are skipping generation of event data and enrollment data.
In order to get data in Data visualizer you can’t skip those when running analytics.