Hello all!
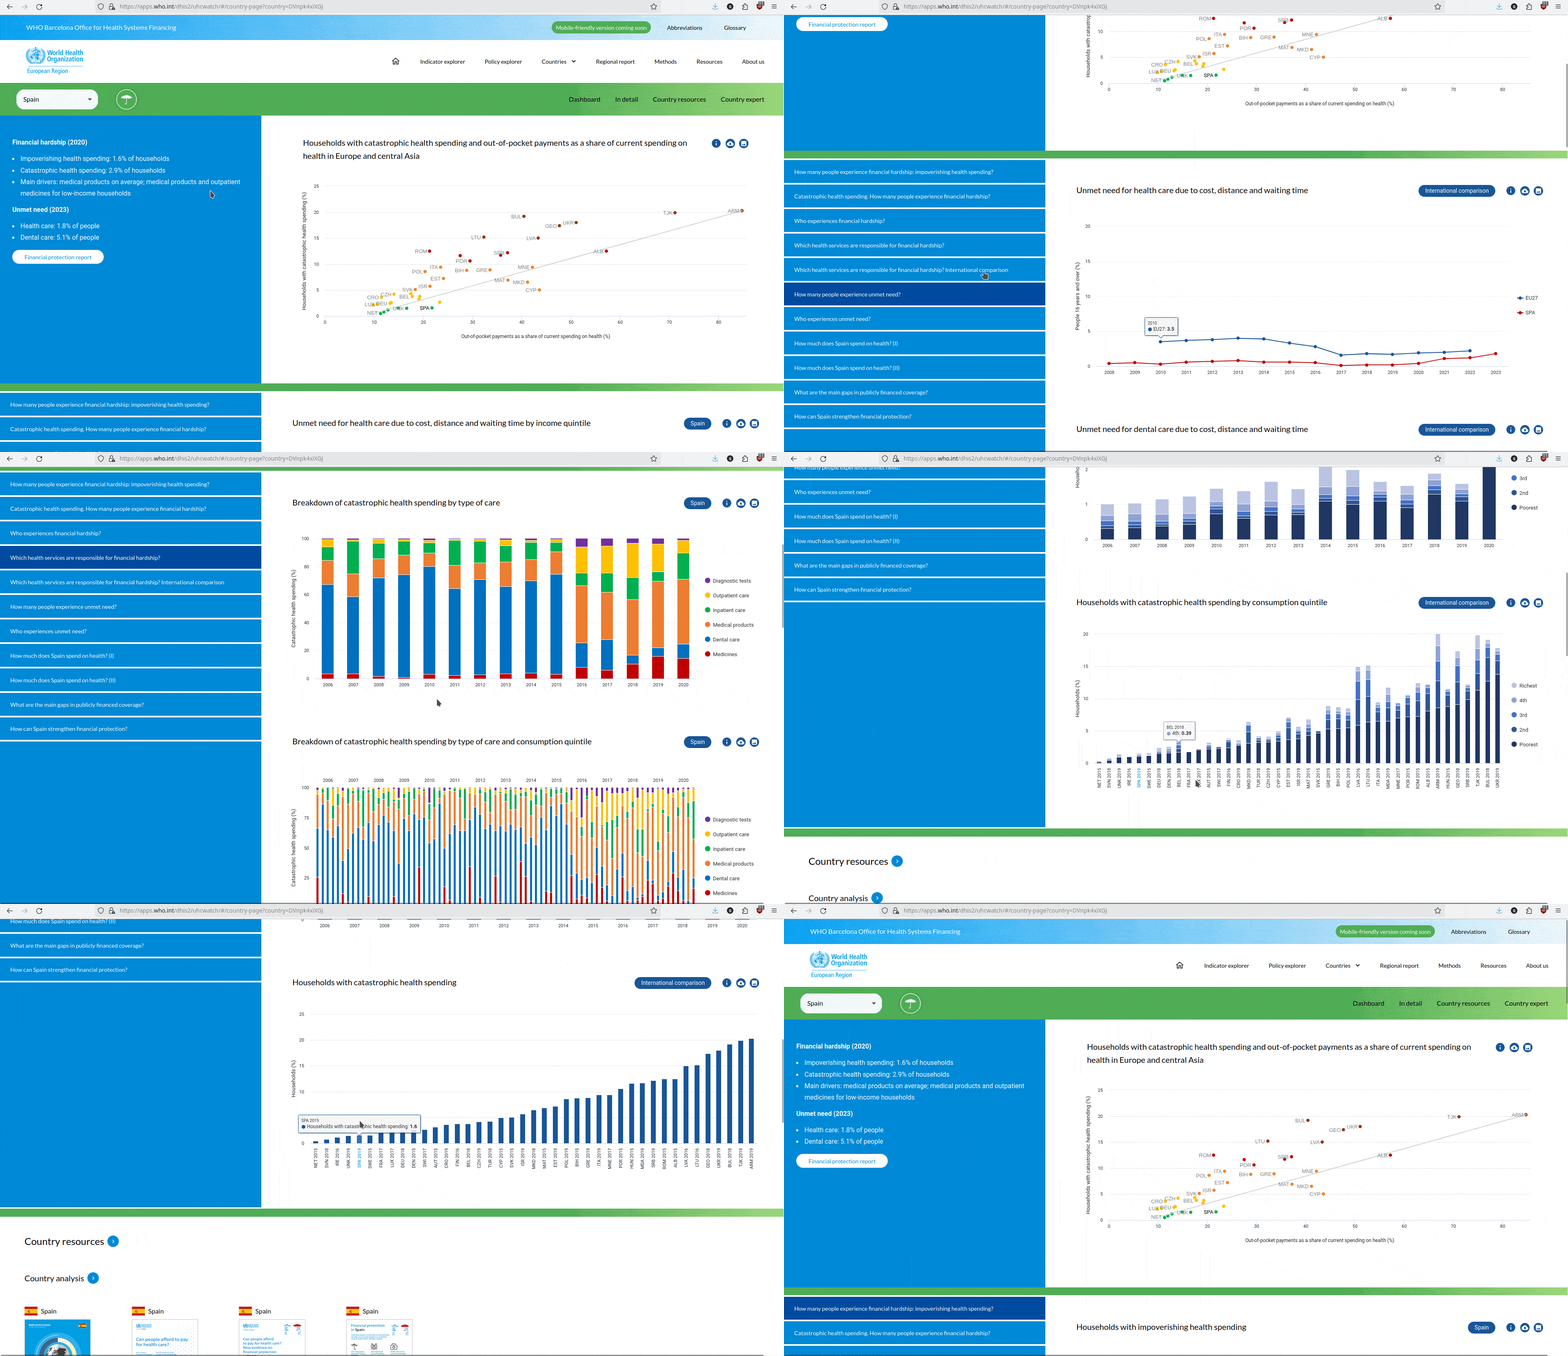
At EyeSeeTea we have prepared this poster to present one of our latest DHIS2 tools: d2-visualization. It allows DHIS2 visualizations customizations not possible through DHIS2 Data Visualizer, such as adjusting fonts, colors, legends, labels, or series.
You can see this library at use on UHC Watch - and you can read more about this DHIS2 implementation on this other poster we will be presenting.

Two main types of customisations are available:
-
For basic customisations, such as adjusting fonts, colors, legends, labels, or series, we retrieve chart data from d2-analytics. After applying the desired customisations, we generate the updated chart using d2-analytics, and it is rendered using HighCharts.
-
For advanced customisations, we also fetch chart data from d2-analytics, but the chart is created directly with HighCharts, bypassing d2-analytics for chart generation. This method offers enhanced customisation options, allowing you to implement anything that HighCharts supports."
Would you find this library useful? We will release the code soon, feel free to write to us if you are interested! Do you want to know more? Look for @ifoche or @adrianquintana (they will be wearing EyeSeeTea t-shirts ;)) during the conference or send us a message!
Poster
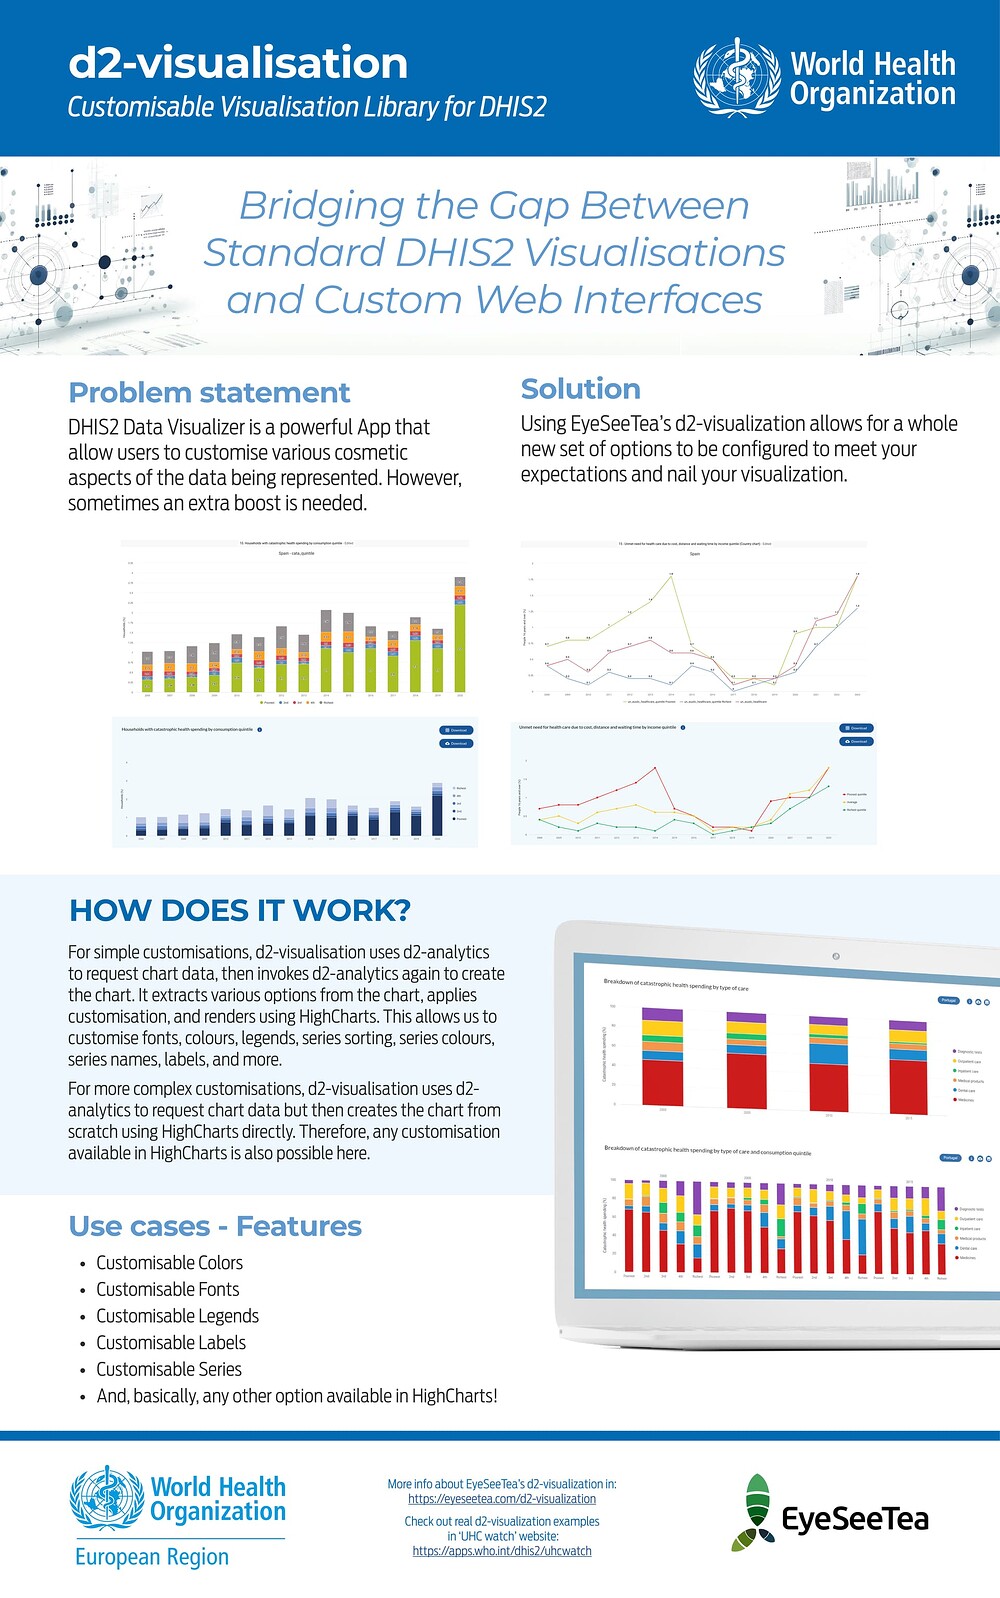
Title: d2-visualisation - Customisable Visualisation Library for DHIS2: Bridging the Gap Between Standard DHIS2 Visualisations and Custom Web Interfaces
Problem Statement
DHIS2 Data Visualizer is a powerful App that allow users to customise various cosmetic aspects of the data being represented. However, sometimes an extra boost is needed.
Solution
Using d2-visualization allows for a whole new set of options to be configured to meet your expectations and nail your visualization.
How does it work?
For simple customisations, d2-visualisation uses d2-analytics to request chart data, then invokes d2-analytics again to create the chart. It extracts various options from the chart, applies customisation, and renders using HighCharts. This allows us to customise fonts, colours, legends, series sorting, series colours, series names, labels, and more.
For more complex customisations, d2-visualisation uses d2-analytics to request chart data but then creates the chart from scratch using HighCharts directly. Therefore, any customisation available in HighCharts is also possible here.
Use cases - Features
- Customisable Colors
- Customisable Fonts
- Customisable Legends
- Customisable Labels
- Customisable Series
- And, basically, any other option available in HighCharts!
Authors: @eyeseetea
d2-visualisation - Customisable Visualisation Library for DHIS2 POSTER.pdf (969.1 KB)
