Hi everyone,
Am wondering why I am not able to add items on the dashboard. I can find the visualizations I want to add, but I can’t see the add button. I am also on a very stable network.
Thoughts?
Hi everyone,
Am wondering why I am not able to add items on the dashboard. I can find the visualizations I want to add, but I can’t see the add button. I am also on a very stable network.
Thoughts?
@INyabuto , any resolution to your issue? I am having the same problem now on 2.28 and cannot yet find a solution.
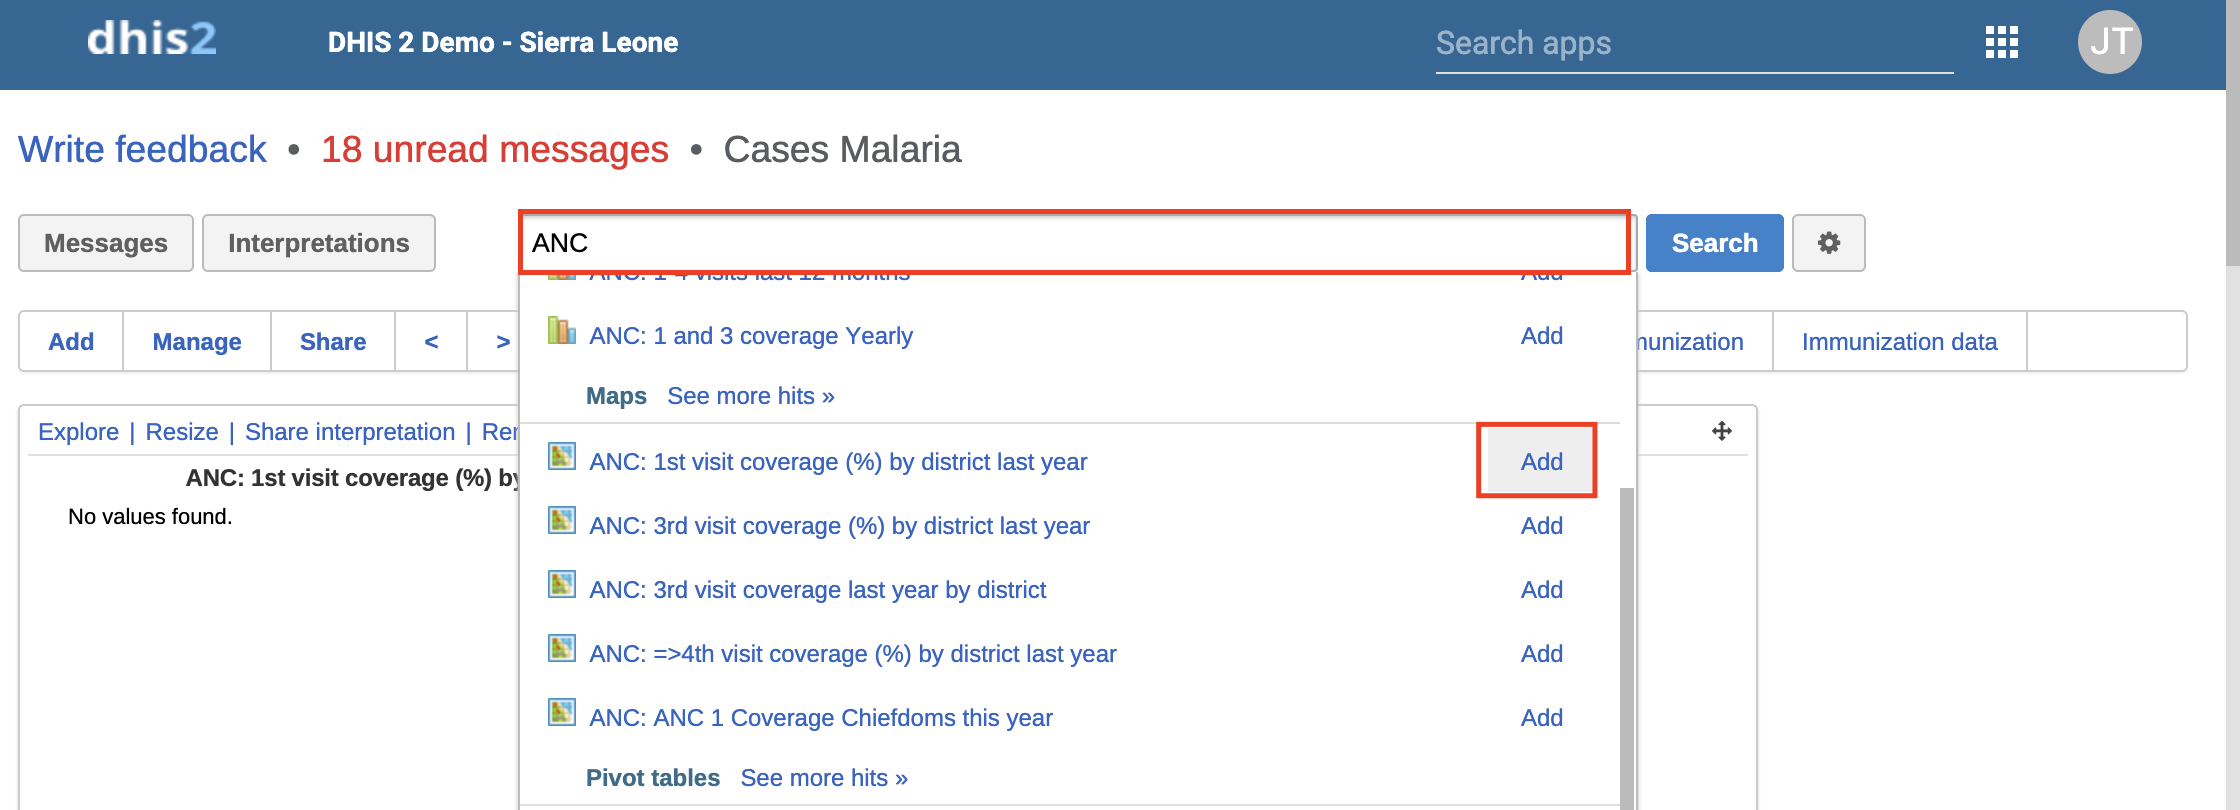
Hi @chase.freeman, to include items on a dashboard, assuming you have created a new one already; you only need to search the item from the main search bar and then click on the “add” button right next to it. The item should appear on the selected dashboard. See below
.If want to add items to an existing dashboard, please make sure you have selected the dashboard first. Otherwise, the item will be added to the chosen dashboard by default.
Hope this helps,
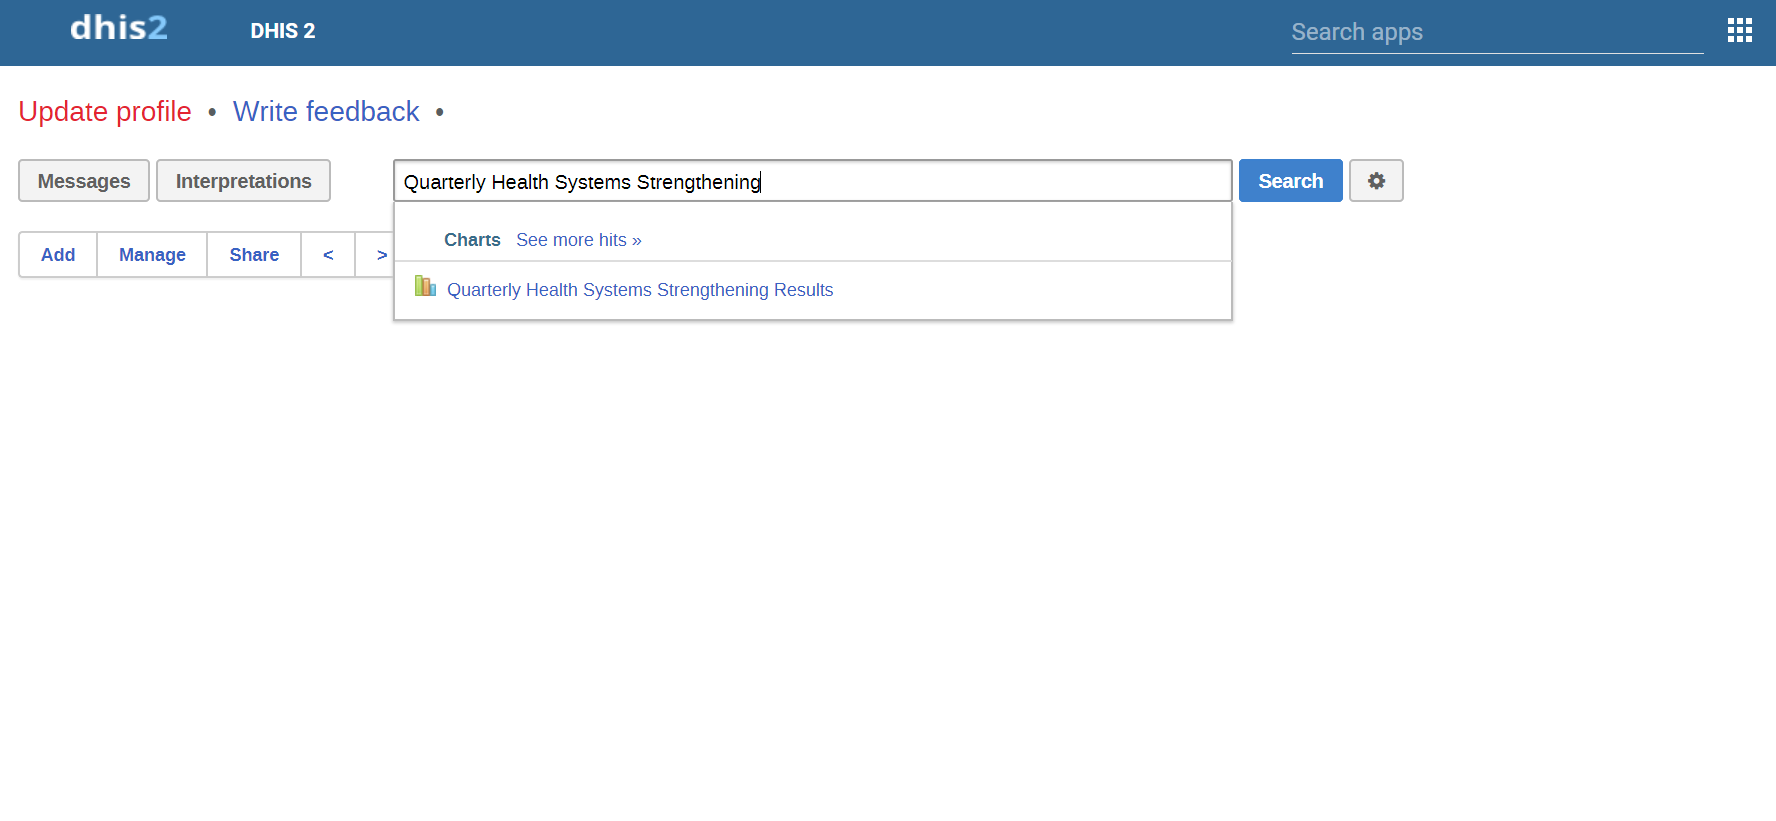
@INyabuto Thank you, but my issue is that I cannot see the ADD button and I don’t know why. I believe you saw my other post with details about the problem.
@chase.freeman, from your screenshot; I notice you haven’t selected the dashboard to include items. This is why you can’t see the add the button.
The first step you need to do is to add a dashboard, then you can search through and include the items you need on the dashboard.
This should work.
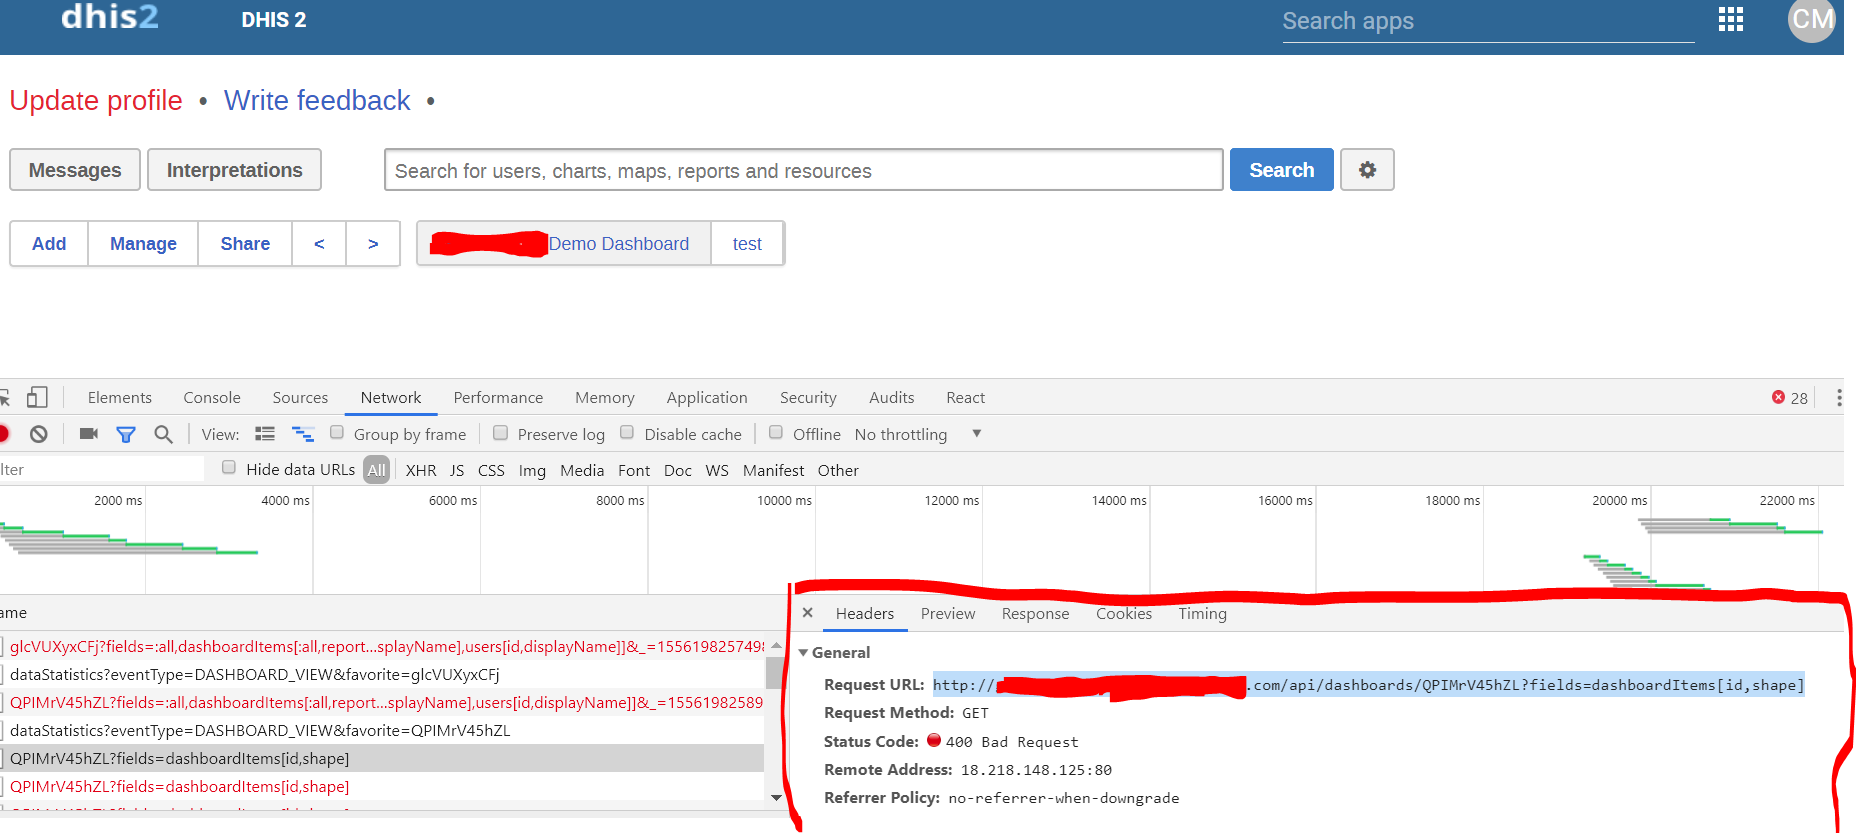
Thank you, @INyabuto. Your advice seems to back up my theory there there is an issue with the server trying to find the dashboard. I do in fact have a dashboard selected you just can’t see it in the screenshot because of the search box. However, the request is being block by the server. I can query the API and see that the dashboard resource exists. But the “400 Bad Request” error is telling me that the server is not processing the request to load the dashboard, so it follows that I cannot add a chart.
I think this may be do to the fact that it is hosted on a subdomain and the request routing isn’t making the server happy. I will try this using the IP address and if that doesn’t work I’m going to stand up a new server with the same docker image to troubleshoot.
Thank you !!
Chase
I’ve stood this up on a fresh server, using the dhis2/dhis2-web docker image and the pgracio/dhis2 docker compose file.
As the default super-user, I created an OU, a dataset with one data element, and then created a chart to visualize it (making sure it is public). I then ADDed a dashboard, searched the Chart, and still no button to Add the chart to the visualization
I resolved this issue by standing up a fresh install of 2.30 downloaded from the Downloads - DHIS2 and following the install guide from the implementation docs (with a few tweaks).
From what I could tell, the dhis2/dhis2-web docker image was supposed to be using 2.30 but was using 2.27 or 2.28. I’m not sure what the root cause of the issue is but I abandoned the docker-approach.
![]()
Hi @chase.freeman,
That was an interesting find… Great to know you resolved this - Thank you for your feedback on this.
Best,
James.