In this discussion thread, feel free to ask questions related to the Tracker and Program Indicators - Experts Lounge session of the 2020 DHIS2 Digital Annual Conference. You can post your questions ahead of, during, or after the session. The panellists will check this thread for questions, and select some for responding to in the session, or follow up after the session has ended. Feel free to respond to other questions or add to them if you have something to follow up with.
Hello Experts! I have a questions regarding the use of the d2:condition.
When using multiple d2:condition in the expression, can the true-expr or false-expr be set to null? Our use case is that we have three tracker data elements that collect coded options from the same option set, we want to count the number of times per event a particular option is selected considering all three data elements. So far we have set this up using multiple d2:conditions in the expression (d2:condition("#{dataElement1}='optionCode1'",1,0)+(d2:condition("#{dataElement2}='optionCode2'",1,0)+(d2:condition("#{dataElement3}='optionCode3'",1,0). However, this makes pivot tables difficult to read because the PI can calculate to 0 if none of the conditions are met. Is there a way to get rid of the zeros so the program indicator presents only values greater than 0?
(currently on v2.33.4)
Interesting question @Kris_Reinhardt! Have you tried using a filter, including only records where at least one of the legal values are present?
Markus
I’ve had issues with Tracker Program Variables as well as Program Indicators interpreting Data elements of type Integer as text… and concatenating the values rather than summing them (as defined in the respective formulas). DHIS v 2.33.4 (and in Play 2.33.6 and 2.34.1) … And it was inconsistent (sometimes things were summed properly, sometimes it was a concatenation of text, sometimes a combination of the 2!) I was able to resolve this by modifying the formulas to multiply each underlying data element by 1 (to force a numerical value). Is this a bug or is there something I’m missing?
Hello again ![]() I have another two questions about how to set up program indicators that make a calculation across multiple stages.
I have another two questions about how to set up program indicators that make a calculation across multiple stages.
In our use case, we have two ‘status’ data elements with coded option sets (one in the first stage when a patient enters the program and the second in the second stage when the patient exits the program). We would like to calculate a count of patients by status (either using the second stage dE result or the first stage dE result if the second stage status is null.
We were able to set this up by using two PI and then aggregating the PI in an indicator. The first PI counted the patients by status in the second stage. The second PI counted patients by status in the first stage if the second stage was null. Both PI used V{enrollment_count} and aggregated to the same custom date using custom boundaries.
Is it possible to set this calculation up as a single PI?
Additionally, when using V{enrollment_count} in the expression, is it possible to prevent zeros from populating in pivot tables, when the filter conditions are not met?
1 Like
Wow! Thanks @Markus. Previously we had just left the filter blank, but the zeros disappear when adding a filter for if any of the data elements mentioned in the d2:condition equal the option we are trying to count.
Is this session taking place in Room 3 now?
Hello all! A few questions/recommendations here (most of which I have posted in JIRA some time ago):
-
d2:round, d2:ceil and d2:floor functions do not work with mathematical expressions. I cannot create an experssion like this: d2:round(DataElement1/DataElement2,0). The functions only work with one data element at a time. This caused me a lot of trouble for a project and we actually built a custom app to bypass this issue.
-
Program indicators of analytics type ‘Enrollment’ cannot be dispalyed using the Events Reports app. Why is that so?
-
If an event has three input fields and 4 other fileds that are assigned with calculations from the previous three fields, the program rules are not calculating in real time. This is because DHIS2 needs action in the event itself, like populating a value to trigger the calculations.
-
Tracker Sections and Section description cannot be translated through the user interface. Section description do not get translated even via json import
-
Are you planning on enabling tracker historical data import, preferably using a csv? In all projects that I have worked so far, there has been historical data for iimport. It would be really nice if csv data import (respecting the proper DHIS2 formatting of course) is available.
-
For indicators that are displayed on Tracker data entry form, it would be nice to be able to custom arrange them. Now tracker just displays them in a chaotic order. I don’t think it is even alphabetical.
1 Like
Hello experts,
When Auto generating Unique ID’s, there is an example ######## that whatever you create cant work. Please advise what characters, integers etc to use.
Your help will be appreciated.
Hi all,
Can you explain the idea behind the Analytics period boundaries for event and enrollment.
Lets say for instance I want to count the number of patients in a specific program and from the enrolled patients, I’d like to know how many have data in a specific stage of a program.
The other question I have is related to data desegregation. What if I want to do desegregation per age how would I perform?
3 Likes
- Do you have any plans in the roadmap to be able to map Program Indicators to Data Elements with catcombos. The current catcombo UIDs are not really useful in that you cannot directly populate an aggregated data element with catcombos other than using some complex ETL process mapping.
3 Likes
Hi, can a data element or indicator from a previous period be used to calculate a current value. For example, numerator from 6 months ago and denominator for current or another period (September or October 2020).
Thank you
@moses_mwale are you generating a unique ID for a Tracked Entity Attribute or are you attempting to do that for another type of object? (I ask because I want to generate a unique ID without incorporating a TE Attribute into my program. I want to keep it as an Event Program.)
Hi, can we have the program indicators of new client and old clients for the tracker data? For new clients we count enrollment data but for old clients could you please specify the expressions?
1 Like
Dear Altruist,
I have following use case regarding program indicators.
Use case descriptions:
I am using tracker capture program to handle billing data.
For each billing items I have created one events. As a concrete example
lets assume I have two events,
E1–consultation fees —10----billing id: 1245
E2-ANC1 visit —0----billing id:1245
Is there any way to calculate my revenue from ANC visits using program indicator? Only two events are sharing common billing id. As ANC visit is part of part of billing 1245, we want to count consultation fees as a revenue for ANC visit.
I posted my question yesterday reposting here again. Looking forward to get your expert opinion on it.
Thanks & Regards,
Sohel
I know I’ve posted this question or requirement many times, but because it’s so helpful feature.
Is it possible to make program indicator that are created on the event level to work with data elements in the reports like event report, for example certain data elements based on age group (which is program indicator).
1 Like
In docs: TextPattern
RANDOM(########)
or
SEQUENTIAL(########)
2 Likes
@LauraLincks yeah its for generating unique ID for TEA. I am trying what @Markus has shared just now.
1 Like
Hi Nirija,
For this case it might be good to use analytics period boundaries. You can have both event and enrollment period boundaries, which would capture “old client” enrollments from previous periods.
For example, this would include all events WITHIN this reporting period, for enrollments within this period AND 5 years before the start of the reporting period.
If looking on pivot table for Year 2020, events within 2020, and enrollments from 2015 through end 2020.
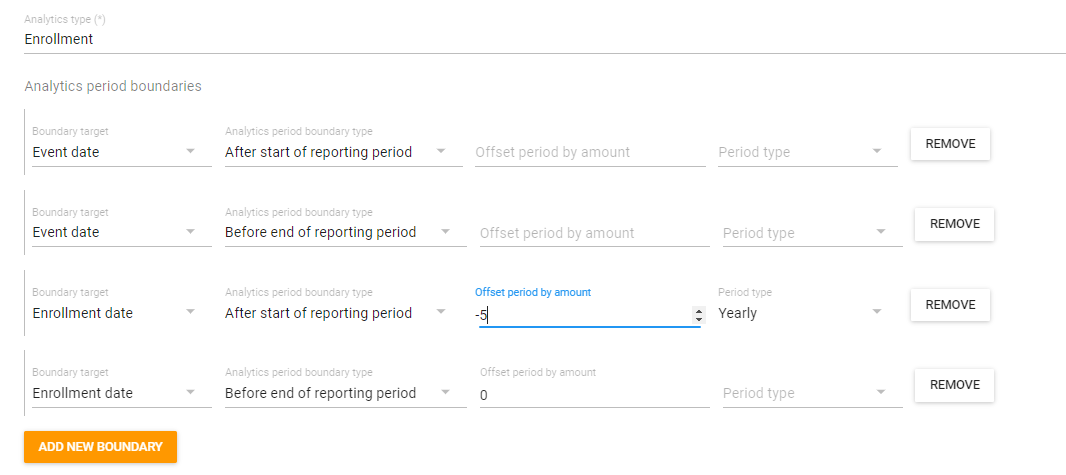
But I am not sure what classifies an “old” and "new " client in your case!
1 Like