Actually “New Client” is the client who visits facility for the first time and “Old Client” is one who comes for follow up visit.
For eg: Client receives Injectable FP service for first time its new client and again comes back after 3 months for another service then the client is old client.
I hope I made you clear.
Hi @Oluwaseun,
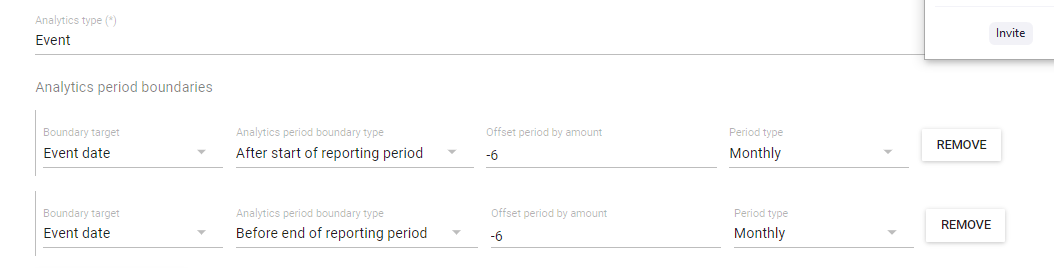
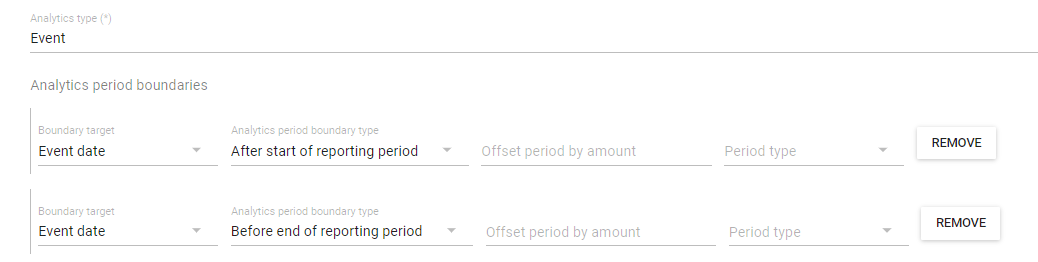
If you are creating an indicator with numerator from 6 months ago and denominator from current period – and the numerator and denominator are enrollment counts from 6 months ago – this may be possible with offset periods analytic period boundaries.
However, I dont think this is possible within an enrollment, e.g. “the average difference between a child’s weight 6 months ago compared to the current month”.
How do we calculate data collected on daily basis from either tracker/event or aggregate statistics in dhis2, are we able to monitor them with some time series analysis methods? Moving average, control limit, calculation of 2 of 3 standard deviations, etc.? Application to COVID. Thanks.
Is there a way to creating an Auto Generated program variable or dE aside from a TE Attribute? I’d like to keep my program as a simple Event Program but would like to generate a sequential ID upon creating or completing an Event.
P.S. this would be aside from a uid… it would be an identifier that would be of practical use to the users.
Since choosing multiple options for one data element is not posible in DHIS2.
Therefore in cases like diagnosis, one of the options is make 3-4 data elements each one of them is the an option set. Is it posible to make program indicator calculate them (different dataelements that have the same value), or I should create program indicators with the same number of the diagnosis and choose if dataElement1 has value 1 and dataElement2 has value 1 and so on for each indicator.
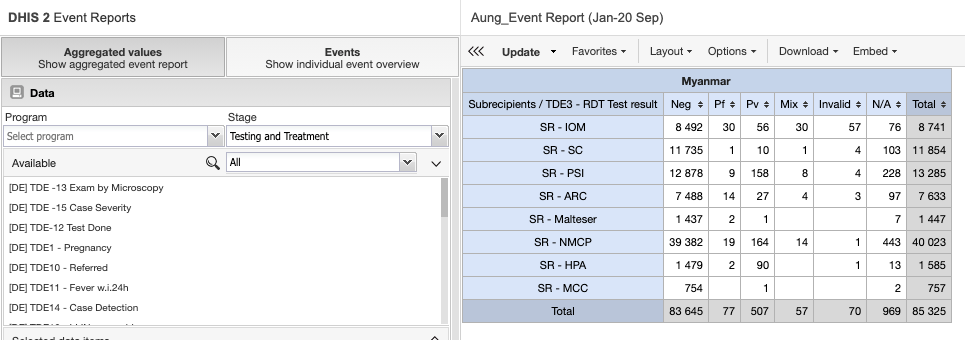
Hi @Markus and @brian, I tried the syntax suggested for the filter [#{dataElement2} == 'status A' || (d2:hasValue{dataElement2} == false && #{dataElement1} == 'status A')]. The syntax worked for creating a single PI to make this calculation! However, there are still zeros appearing in pivot tables (either from use of the enrollment count or the custom date boundaries used?)
Great question. For most of these robust analyses might recommend exporting data out of DHIS2 into Python, R, or EPI Info. However there are some ways to get at your example metrics with program indicators and validation rules. You may also be interested in predictors if working with aggregate data Home - DHIS2 Documentation
Standard deviation. This is an aggregation type within the program indicator options.
If working with aggregate data, you can also run standard deviation outlier analysis. Home - DHIS2 Documentation
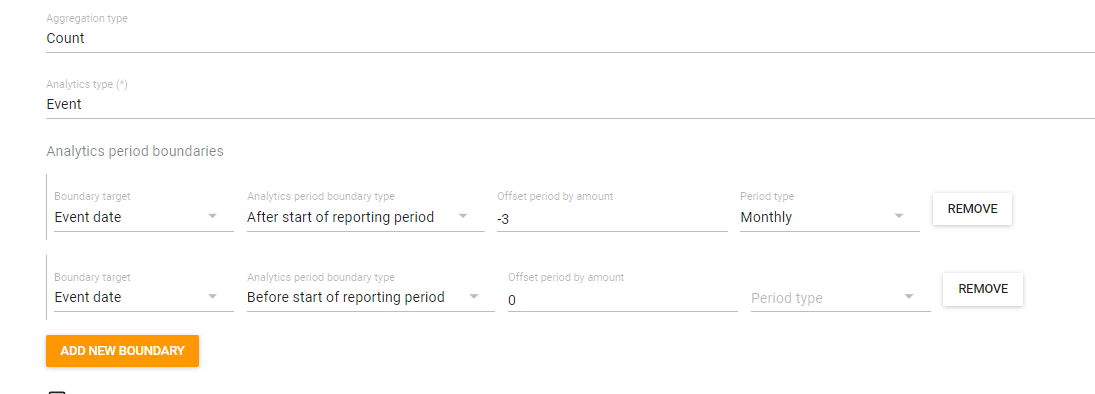
Moving average To get a 3 month rolling average of case counts, you could use analytic period boundaries to get the previous 3 months of events, and be sure to include " V{event_count} / 3 " in the expression. (Note this could also be done for enrollments, or another data element value).
Control limit This might be more complicated to visualize in DHIS2, as you are presumably showing control limit for a long period, with observations for smaller units across the period (daily average with yearly CL). But you could calculate 3 times the standard deviation as a program indicator if it helps. If using aggregate, I recommend checking out predictors and validation rules.
Thanks Brian, will try with Malawi team on this and share with the community. We are looking into applying some quality control method to monitor COVID related indicators/data elements.