We upgraded on our development instance for a given country to 2.38.1.1 (from 2.36.x) to overcome some bugs/limitations and are having the following weird effect on pivot tables for two of the program attributes when they are added to the pivot.
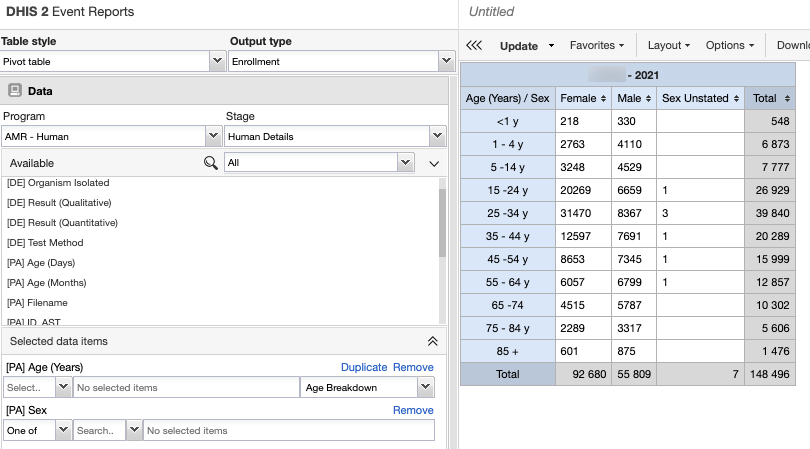
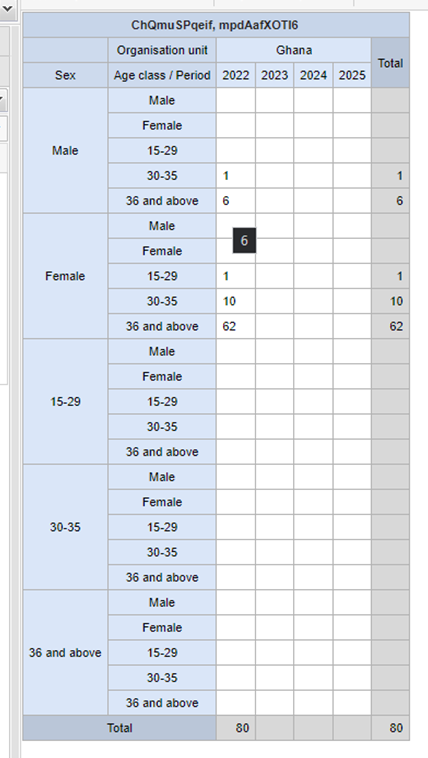
The first image below shows a simple age-sex distribution for a series of national lab test results. All looks well. When we add in the ‘sample types’ or ‘laboratories’ attributes, which use option sets (as does sex), items are duplicated on both columns and rows - in effect a matrix.
I remember seeing a similar issue before in the CoP but can’t remember the title exactly. It exactly in the pivot table in events reports app. If I find it I’ll add it here.
Is it possible to reproduce this on the play instance?
I’ll give it a go in Play… but suspect you would have been inundated with complaints if this was a common problem.
Note that it only displays when some attributes were dragged onto the columns/rows, and not for others. Program attributes with small option sets, or no option sets seem fine, but those with larger option sets linked to them caused a problem. However, we have rolled backwardsto 2.36.12 to continue our work as we are under some time constraints.
On a side note: One of the real issues we were trying to overcome in rolling forward was that ‘conditions’ set in the filters of Event Reports and saved as favourites disappear when you re-open them in the App. We have hundreds of pivot-table Event Reports spread across 4 different sites and maintaining them or using them is a real pain when you had to reenter all the filters everytime you wanted to make a change.