Hi all,
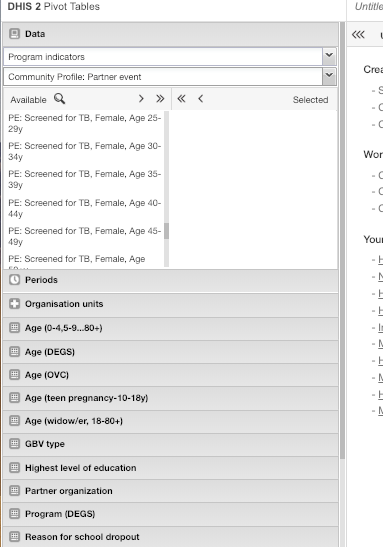
Is there any way to use the disaggregates (on the lefthand bottom side of the pivot table app, for example) when looking at program indicators? I have program indicators that aggregate data elements from an event program - right now I am adding up the data elements (attendance by age, sex, age/sex, etc). But the disaggregate function is much more elegant and leaves the indicator list less cluttered. I tried to do it using data element groups and group sets but no data is showing up. Thanks!
~Natalie
2 Likes
Hi Natalie,
Are you able to see those dimensions on the left pane (Did you include [check] the data dimension from the category?) If yes, they should appear on the left lane.
Kindly share these for better support
- Screenshot of the data element configuration page
- Screenshot for the Category Configuration page
Best,
James.
1 Like
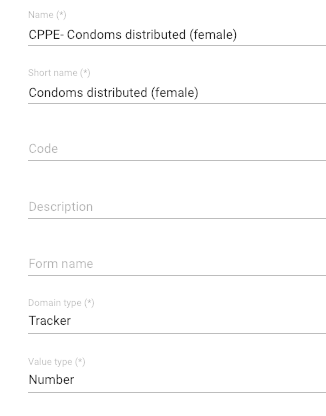
Thanks James! I can see the dimensions for disaggregates that apply to aggregate data elements, but I’m wondering if it’s possible to formally disaggregate a program indicator based on EVENT data (so the “domain type” is tracker rather than aggregate) - meaning the disaggregates show up in the pivot table app rather than creating separate program indicators for each disaggregate. Does that make sense? I have screenshots here. I understand that the disaggregates will not work now because they only apply to aggregate data element but wondering if there’s any kind of workaround for program indicators based on event/tracker data. Thank you!!!
2 Likes
Hi Natalie,
It depends what you need the data for. If you only need the breakups and don’t need to compare it to other aggregate data, you could also try applying legend sets to your age data elements in order to aggregate the data into age groups. You would then run your report in event reports, not pivot table. It can be a bit time consuming to create all of the program indicators and unfortunately there is no quick way to apply the disaggregation otherwise. Give the legend set a try however and see if it may work for you.
These types of reports look something like this:
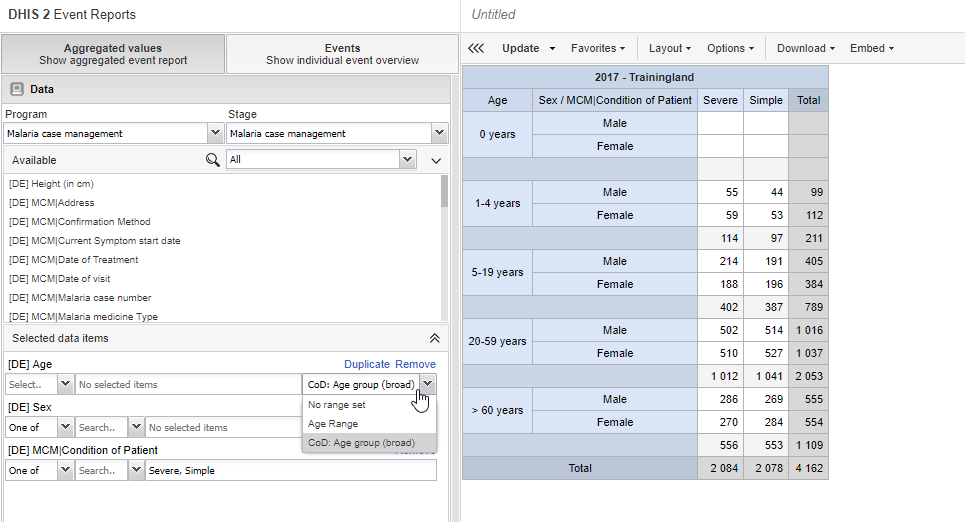
4 Likes
@Natalie_Tibbels - was this helpful in sorting you out?
James.
Thank you!! This is a good workaround. May shift it over in development to see if something can be done for use in pivot tables with the data dimension fields below. I know so many of us are using tracker and wanting to analyze our tracker data by age, sex, etc!
1 Like
Hi Natalie,
I’m curious what solution you ended up using to analyze your tracker data by various disags?
Ned
1 Like
Hi,
For age I did a legend set as suggested above which is helpful when I want to use event reports. But I still ended up doing a million individual program indicators for every disaggregate to be able to use pivot tables and maps. I didn’t solve the data element groups/group sets issue, but I did create indicator groups to try to keep them a little more organized and easy to find…
~Natalie
1 Like