I hope this message finds you well, all data are stored in one column named as value in datavalue table.
need a query, show each dataelement with its value. I have used Crosstab in PostgreSQL but not worked but worked a lot in Sql server with pivot working.
in data visualizer app it is showing well but I need in Query and add it sql view.
With Best Regards
Mohammad Ayub Yousafzai
Kabul , Afghanistan
I really recommend using PgAdmin for queries and understanding the DB’s schema. Here’s a simple query that will show “data element name” : “value” from the two tables you mentioned:
SELECT dataelement.name, datavalue.value
FROM datavalue
JOIN dataelement
ON datavalue.dataelementid = dataelement.dataelementid
I checked, the raw query of Sql in data visualizer download section but it also shows all values in one column. I wanted to display each value with its column name like we design custom dataset form for Data Entry.
To change the rows to columns can be a bit complicated in PostgreSQL. First, we don’t know the values a head of time and they are changing so this makes it even more challenging in SQL. Second, we don’t know the number of rows a head of time. Third, both the number of results and the actual values are not static.
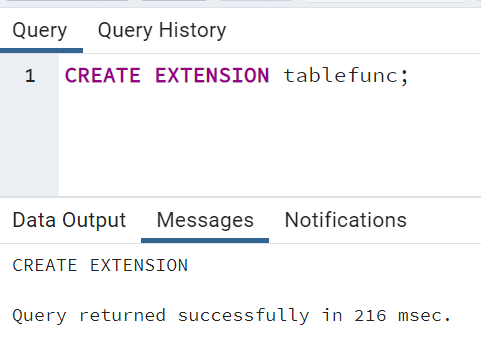
However, if those challenges can be by passed (for instance, you know that the number of rows to be changed to columns are 10), then you might be able to make use of a function called crosstab.
crosstab ( source_sql text, category_sql text ) → setof record

Produces a “pivot table” with the value columns specified by a second query.
However, I believe we’ve taken a complicated and unnecessary path that might be achievable using the Data Visualizer app or the DHIS2 API, so if you’d like to share about the use case itself, it might help a lot more.