Hi all experts,
Could I kindly request your explanation regarding the differences between V{enrollment_count}, V{tei_count}, and V{event_count} in the context of a program indicator’s expression?
Thank you very much in advance.
Hello Somkhit,
enrollment_count counts the number of enrollment in a given tracker program (a same tracked entity can be enrolled several times in a single program depending on the configuration).
tei_count counts the number of tracked entities enrolled in a given program (regardless of the number of times they’ve been enrolled in that program).
event_count counts the number of events (~forms/stages/…) encoded for a given tracker program.
Best regards,
Thomas
Hi Somkhit,
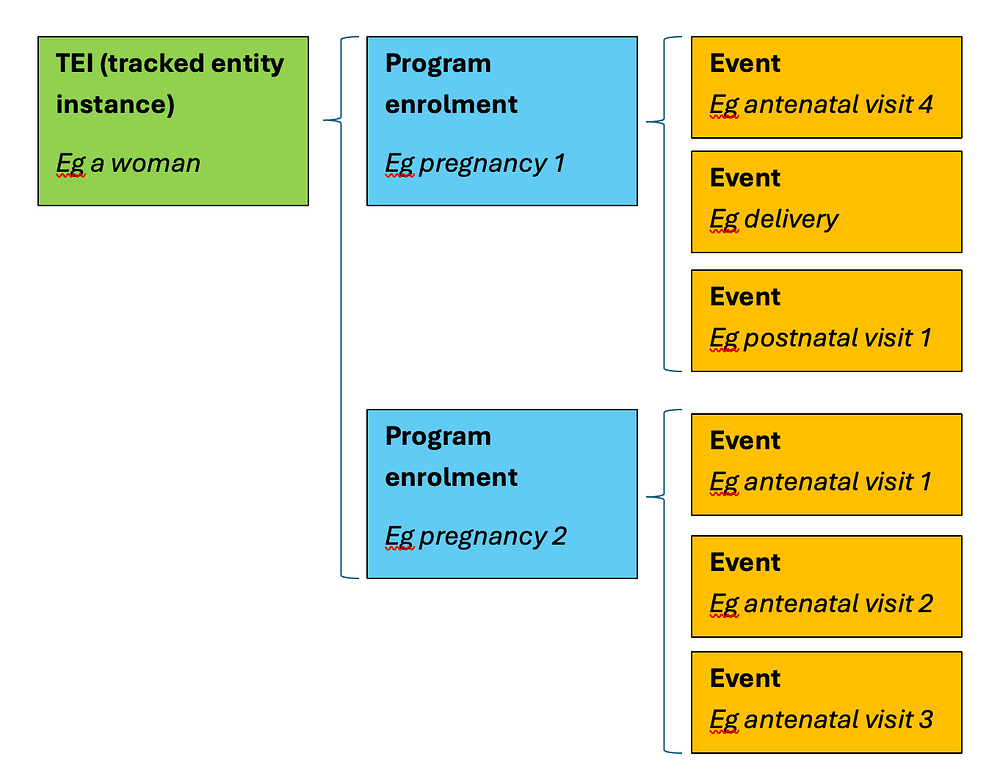
A small diagram might help - in the example below, assuming that all of these happened within the same period, the tei_count would be 1, the enrolment_count would be 2 and the event_count would be 6.
Cheers, Sam.
Hi @SamuelJohnson,
I have difficulty in knowing which one to use depending upon the configuration of a tracker program. A tracker program may sometimes consist of only non-repeatable stages, sometimes it may consist of non-repeatable and repeatable stages, and sometimes it may consist of only repeatable stages. In all these three scenarios, how to know which one to use in the program indicators taking into consideration that a PI has the following parts:
Analytics Type
Aggregation Type
Expression
Filter
Could you give more details from the above diagram?
Thanks
Hi Fernando,
This is a huge and complex area - you could write a whole book, and different experts will have their own approaches to some of it. So I won’t talk about indicator design in general, but I will comment on two aspects of your question that are very relevant to this specific thread:
-
Repeatable/non-repeatable stages will only really affect things if you’re looking at events / event_count. (An event = an instance of a program stage.) If you’re using enrollment_count or tei_count, it doesn’t really matter how many events you have in the third column of the diagram, as you’re only counting the items in the first or second columns of the diagram.
-
The period you’re looking at is also very important. For example, enrolment_count will only count enrolments in the period in which the enrolment initially happened - so even if that same enrolment is still active in subsequent periods, enrollment_count won’t capture it in those subsequent periods.
Overall, my general advice is to try to stay as far to the right of the diagram as possible when counting/measuring things - eg base your indicator on events rather than enrolments if feasible. This will make things simpler, and it means you only capture actual activity (eg if patient has been enrolled but not yet had any events, you probably don’t want to count them).
Hi @fernandoshake ,
You may want to explore the DHIS2 tracker design guide which goes into these PI design questions in some detail, including the four parameters you highlighted.
I do have two small additions to make to @SamuelJohnson’s solid points above:
enrolment_count will only count enrolments in the period in which the enrolment initially happened
This is true under the assumption that analytic period boundaries capture all enrollment dates between the beginning and the end of the analytics period. If those period boundaries are the event date, then all enrollments with at least one event within the period will be counted.
…base your indicator on events rather than enrolments if feasible.
Implementers must ask: do I want to sum up all encounters, or just the unique persons? It is indeed simpler to count only the encounters (events). In an HIS context, a patient would likely only be seen once for a given day at a given location. For understanding operational management from the health centre’s perspective throughput, patient load, etc) this might be enough.
But sometimes, to describe health care in terms of population impact (quality of care, coverage, etc) you need to know the number of distinct patients who received services within a given area and during a given period. Here you need to avoid double counting patients, so you really must think carefully how these PI would be aggregated across both period and orgUnit dimensions, and consider how they will be interpreted. Enrollment_count may be more appropriate.
Hi @brian,
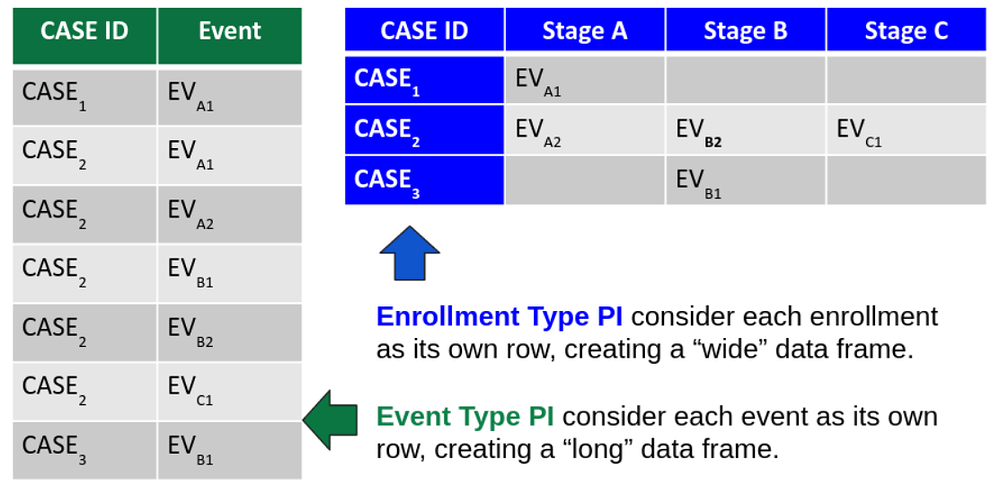
I opened the link you have shared, but while I was looking at these two tables, I got a bit confused: In the table about Event type PI for Case2, we have EVA1, EVB1, but, for enrollment type PI, we do not have these two events for the same Case2. Am I interpreting the tables correctly?
Thanks
Hi Brian,
I’m probably trying to over-simplify this… and the problem is that PIs are pretty damned complex. ![]()
The guide you shared is great for more experienced DHIS2 users, but I think there’s still a gap in terms of simpler documentation for people who are starting out with PIs, and aren’t yet ready to tackle the more sophisticated aspects of PI design… If you (or anyone else) know of any good, simple introductions to PIs, I’d be very interested in using them for our in-country work. ![]()
hi @fernandoshake yes that is correct.
See the text above the graphic:
Enrollment Type: Dimensions based on enrollment org unit and (by default) enrollment date. Can evaluate data values from across multiple program stages, but when querying based on a single data element value, evaluates data from the most recent event of each repeatable stage by default.
So, if you are querying a data element value from a repeatable stage in an enrollment type PI, then only the data element value in the latest event would be evaluated.
I dont mean to overly complicate a thread on a more basic question (which has already been answered!). But I can share a quick example using the ANC Tracker diagram above.
Each visit in the repeatable ANC stage has a data element systolic blood pressure reading (SBP). You want to count the number of pregnancies seen this year with gestational hypertension (SBP > 140).
You make an enrollment type PI with V{enrollment_count} expression. Then in filter you add: V{SBP} > 140
BUT, there could be a patient with a first visit SBP of 150, but her second visit its 100. This PI will only evaluate the latest SBP reading, so her pregnancy will not be counted in your total.
This is a quirk of enrollment type PI to keep in mind.
To count pregnancies that ever had a gestational hypertension in any visit, then the filter should be d2:countIfValue(V{SBP} > 140) > 1 These more advanced functions are covered later in the guide.
Totally agree! And its an area we are actively working to make clearer and more efficient.
We have some simpler and more hands-on materials in the Tracker Use Academies, maybe its useful.
Unfortunately, multidimensional analysis of longitudinal data is inherently very complex. Building generic tools to support such tasks means theres a need to balance both simplicity for end users, and flexibility to do more advanced tasks.
If in your in-country work, you find any ideas for new features (or docs!) to help make designing PI easier, please do drop a line here or on Jira. ![]()
Hi @brian and @SamuelJohnson,
Thanks for sharing your knowledge about program indicators. For beginners, PIs are really difficult to grasp.

