I need guideline that how to create monthly predictor and how to use it in graphs/ reports
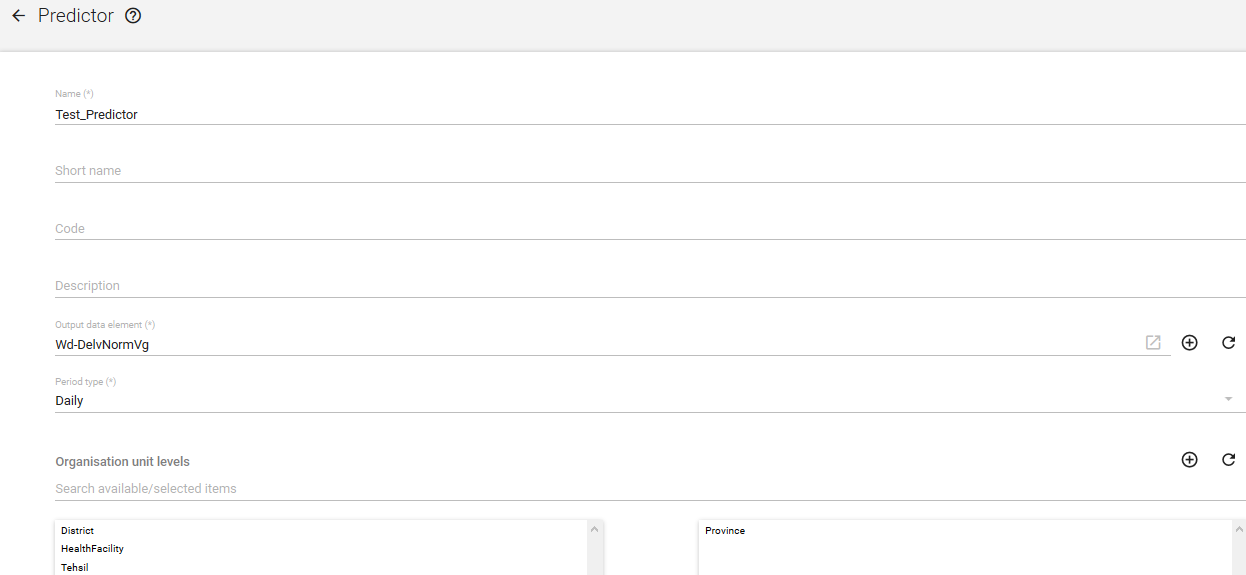
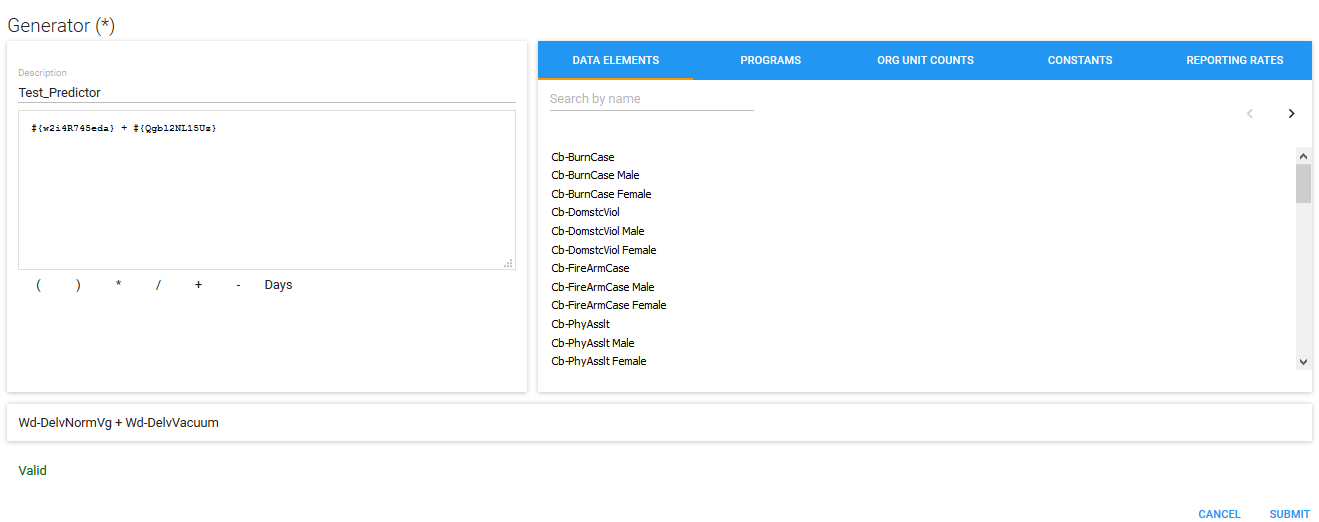
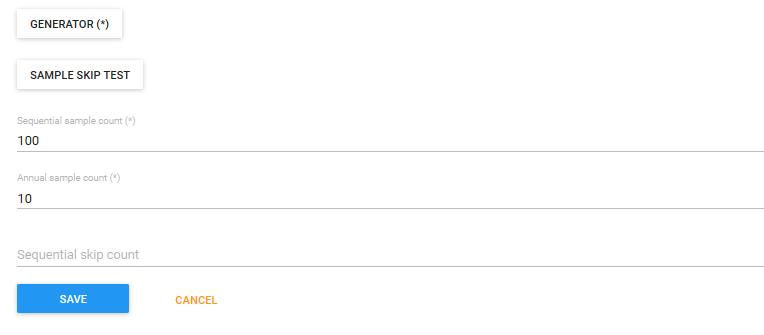
Suppose I have data element “Normal Deliveries”, I would like to create its predictor as per below screen shot/steps but i do not know that how can i use it… please guide me
Hi @mrjavedakram
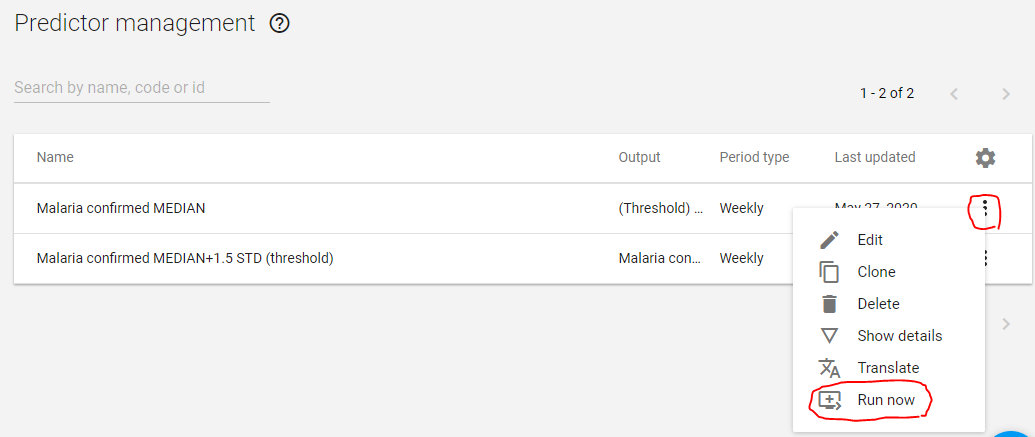
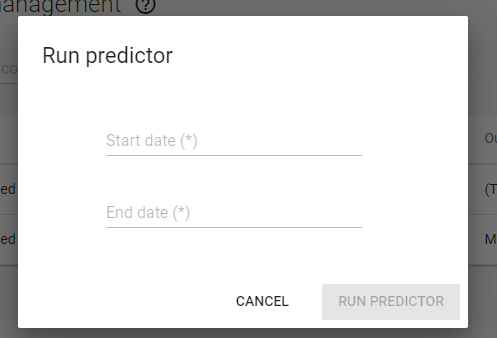
Do you need it to be a predictor? why you just can’t make it an indicator which will be calculated on the fly whenever you want without taking any space in the database. Predicatord are usually used to calculate thresholds from different input variables for different periods which may requires calculation steps and conditions that are not available with indicators. However, if your use case needs it to be a predicator, after the creation of the predicator, you need to run it on a date range (from date to date), as in the following images:
then dhis will start calculating and generating the predicator and store the result of calculation into the data element you provided inside the predicator during creation time which I think you named it Test_Predicator, if the predicator runs successfully, then you can make the result show up in reports or pivot tables by selecting that data element you provided (Test_Predicator) like when you select any other data element in the pivot table. (You may need to run Analytics after each predicator run so the dataelemnt values show-up in the reports)
The result of the predicator will be stored in the data element and whenever you need to have the data of a different date range you need to run the predicator again for that date range.
for simple calculations, indicators often are a good choice, they may give you the same result without the need to repeatedly run it, and it’s calculated automatically at run time, nothing gets stored in the database, and whenevr you need to change the indicator you just remove it and create another one, it’s much efficient and great for many use-cases.
Dear Hamza, thanks for the detailed reply, i think Javed wants to predict the values of data elements , based on the past values. which is not in scope of indicator.
So he must use predictor. Also i tried implementing it , but i am still not successfull in using the values.
Hi @ahmed685, thank you for your clarification, actually I once had a similar issue, in your case after running the predicator does it show a message at the bottom telling you the amount of data generated? it has to show this message if the generation is succeeded.
In my case, I tried multiple times with different configuration for the years and the date range until this message showed up with the number of data values generated, with me I think there was something wrong with the data of some of the previous years and when I excluded them it succeeded.
Some common mistakes in making predictors:
A. Make sure that you have selected an org unit level. Typically this is the same level where the data that is used in the generator/calculation is captured.
B. Make sure that in the generator you have an [aggregation function.]
C. Make sure that the there is actual data in the data elements that make up the generator calculation. D. Make sure that the data value type, aggregation type, and option to store zero values in the data element that is assigned to the predictor is in agreement with the type of values that would be generated by the predictor.
Steps after you have made the predictor
Run the predictor. - If you want it to generate values for future periods you have to make sure those periods are included in your start and end data selection
Run the analytics tables in the data admin app
Clear your cache and use incognito mode in google chrome
In the data visualizer application check if the data element assigned to the predictor if the values were created. You could also check in a data entry data set if you have assigned that data element to a data set.
Here are some steps to troubleshooting:
If you run the predictor, the analytics tables, and clear you cache but do not see anything in the analytics then check make a data set and assign the data element to the data set and check the data entry app to see if the predictor actually generated a value. Remember that if it generated a 0 and that data element is not set to store 0’s then it will not show anything. If it is showing in the data entry and not in the analytics then it is probably a cache issue. Try using incognito mode in google chrome.
If the predictor does not produce a value for future periods then double check that there is sufficient data in the data elements that are in the generator calculation for a value to be produced.