We are creating a survey as an event program (it will be assigned to districts) to assess services provided in the districts. The survey covers different services per area, and we must build program indicators which are individual scores per area. In the program indicator expression, we will be summing the values of data elements corresponding to each area to get the score.
In other words, we will have a score for:
Area A - v%
Area B – x%
Area C – y%
Area Z – z %
At the end of the day, we want the following output in the visualization:
1. Individual score per area per district 2. Aggregate score per area per province
Our question is what aggregation type we can use. taking our output into consideration?
The org unit hierarchy is country, provinces, districts, and HFs. Data will be collected at the district level
Hi @dmbantu,
In regards to your question, can you specify/give examples of the services provided and what data type is collected per those services (boolean or integer)? and also clarify what you mean by ‘per area’ because ‘area’ isn’t a part of the organisation units.
I hope our response is able to solve the issue you were facing.
With from the Dhistance Team.
DHISTANCE.com: The Easiest DHIS2 Setup. Up and running in 5 minutes!
No technical knowledge needed! Great Support with Data Security/Confidentiality.
The data type collected per services is Boolean. What we mean by area is that the survey consists of sections/areas (family planning, pharmacy, child maternal health, Adolescent Friendly Health Services. We must calculate scores related to Boolean questions in each section, so we should get scores for:
*family planning, *
*pharmacy, *
*child maternal health, * Adolescent Friendly Health Services
and display the results in the visualization App ( What score we got for family planning for district A, B, C…; what score we got for child maternal health for districts A, B, C … etc,)
If I’m understanding, you have a collection of questions (5, say), per area, and you are giving a % score in each area based on the responses (0, 20, 40, 60, 80, 100 %). At the district there would be no aggregation, as a single event would be a single score.
For the aggregate score, given its a percentage, I would assume you’d want to average the Program Indicator. Summing would seem erroneous (two 60% scores would become 120% or 1.2, which doesn’t seem useful). The only caveat I suppose would be if there is a consideration of weight. i.e. if someone doesn’t answer a question in the area, does the score become a score out of 4 questions? and if someone answers 4 questions, and someone else answers 5 questions, do you want all “correct” reponses to be scored over 9, or do you want two total scores to be averaged by 2?
If you want weight brought in, you’d best be suited by creating two program indicators per area: one for the numerator, one for the denominator. Then you can bring those into an Indicator and your weight will be respected.
If you don’t need this consideration of weight, I don’t see why a Program Indicator simply set to average wouldn’t do just fine. As an aside, you could also set up a Data Element and assign these scores to them, if its useful that the entrant sees the scores as they enter in the data.
We suggest you use a ‘count’ as the aggregation type. I assume that there are corresponding services for each area, and that you are collecting yes/no values for each question.
For the aggregate score, you can calculate the total number of ‘yes’ options for the numerator, and the denominator can be the total number of services * 100 for each district.
Based on my understanding of what you posted and like @e4eDHIS2 said, I think the aggregation type should be count for both the data element and the program indicator. In the expression and filter, you can specify what is to be counted e.g. V{event_count}, #{xxxxxx.xxxxx}==1 (something like that)
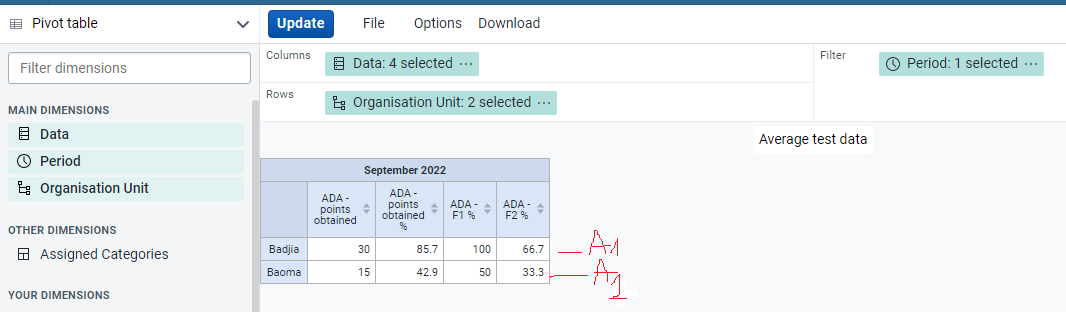
I just created ,in demo, test data elements for one area and program indicators with average as aggregation type: and expression (he total number of ‘yes’ options for the numerator, and the denominator the total number of services * 100)
For me. these percentages seem to be the individuals percentages for the two districts, which is one of the requirements. How to get the aggregate value for each indicator in both district?
Note: F1 and F2 are percentages for subareas of Area 1
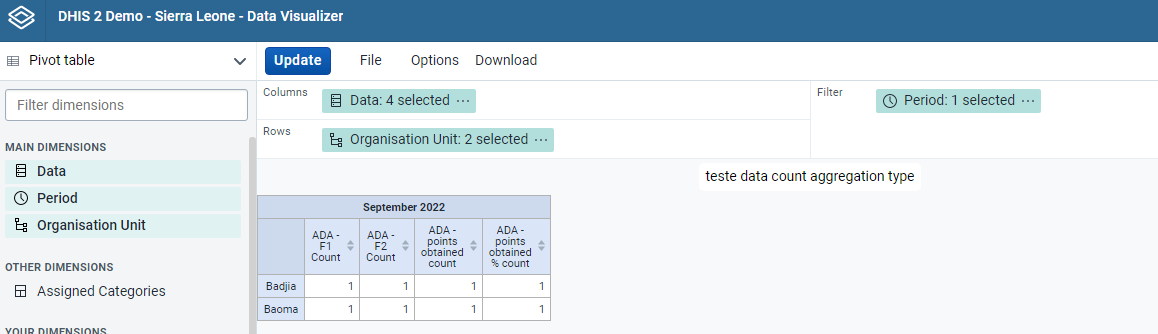
Using count as an aggregation type and expression* as (he total number of ‘yes’ options for the numerator, and the denominator the total number of services * 100)) for program indicators gives me the following result
agree with @e4eDHIS2 that if you’re using an indicator, count would work as an aggregation. My guess is the step that you’re not doing in the above @dmbantu is integrating two individual program indicators each with count aggregates for the numerator and denominator into a single indicator, where the Program Indicators are pulled (into numerator and denominator).
if you are only using 1 program indicator for this solution, and you are ok with the scores being relevant to a single submission and weighted equally with any other submission, then what you have created should be fine, just aggregate the data at a higher OU to see the scores average at that level selected.