I am trying to embed DHIS charts and tables in a website. I tried both the embed snippet available in visualizer as well as that in Web API doc - 1.40.1 Embedding pivot tables with the Pivot Table plug-in.
I am developing on localhost. First off, the CDN URLs (shown below) provided in both snippets does not resolve.
Kindly be patient as the community members look into helping you out with this issue. Our team from @dhis2-analytics will also have a look at this and advise.
Thanks @jan, I had used the reportable.js from the dhis demo site before and now on your advice I have also downloaded the jquery file but I still get the old error and one additional. See my full code below:
<!DOCTYPE html>
<script>
    reportTablePlugin.url = "https://play.dhis2.org/demo";
    reportTablePlugin.username = "admin";
    reportTablePlugin.password = "district";
    reportTablePlugin.loadingIndicator = true;

    // Referring to an existing table through the id parameter, render to "report1" div

    var r1 = { el: "report1", id: "R0DVGvXDUNP" };

    // Table configuration, render to "report2" div

    var r2 = {
        el: "report2",
        columns: [
            {dimension: "dx", items: [{id: "YtbsuPPo010"}, {id: "l6byfWFUGaP"}]}
        ],
        rows: [
            {dimension: "pe", items: [{id: "LAST_12_MONTHS"}]}
        ],
        filters: [
            {dimension: "ou", items: [{id: "USER_ORGUNIT"}]}
        ],

        // All following properties are optional
        title: "My custom title",
        showColTotals: false,
        showRowTotals: false,
        showColSubTotals: false,
        showRowSubTotals: false,
        showDimensionLabels: false,
        hideEmptyRows: true,
        skipRounding: true,
        aggregationType: "AVERAGE",
        showHierarchy: true,
        completedOnly: true,
        displayDensity: "COMFORTABLE",
        fontSize: "SMALL",
        digitGroupSeparator: "COMMA",
        legendSet: {id: "fqs276KXCXi"}
    };

    reportTablePlugin.load([r1, r2]);
</script>
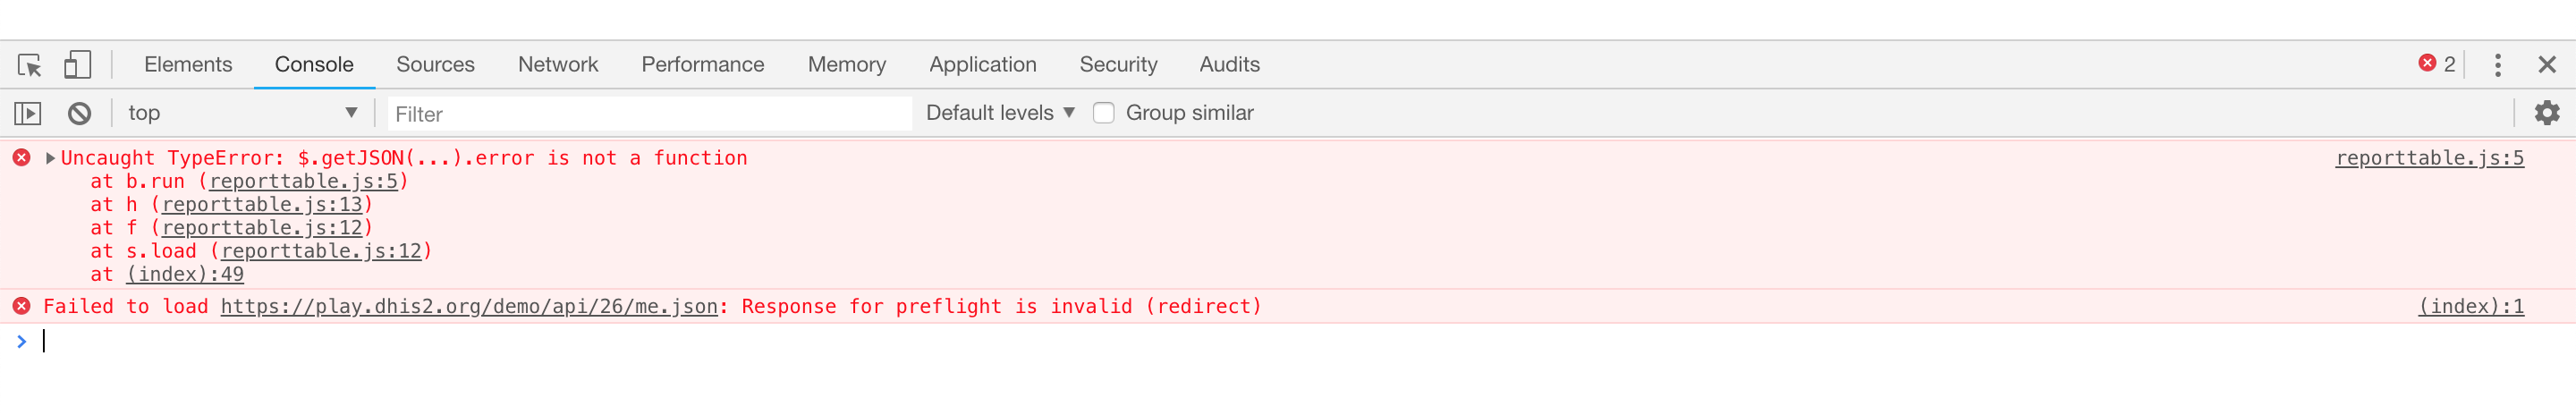
And this is the error console from my browser now:
Thanks @jan How about the other plugins for Maps (GIS), and Charts. Is it possible to update even the dynamically generated embed codes to point to the right URL instead of the cdn?
Hi All, I have managed to embed charts on other versions of 2.32.3 and below BUT on 2.33+, the chart.js seems to be not accessible. Has the implementation changed to give possibilities to integrate into a web portal or or dhis2 app if so, how is it now done as there no documentation for 2.33+ on integrating charts. for now the report Table and map seems to work.
The Classic Data Visualizer app, which generates that plugin, is no longer supported in 2.33+. In the new DV app we are using a more modern tech stack based on React, so the “chart plugin” is now a React component (published here: https://www.npmjs.com/package/@dhis2/data-visualizer-plugin).