Hello Everyone.
We are using DHIS2 2.29 build revision aafaa5d
We have a data element, Number of adults and children currently receiving ART which we created with aggregation type Last value (sum in org unit hierarchy). This data element has category option combos for age (<1 to 50+), sex (M,F), military/civilian status, and regimen line (1st, 2nd, Salvage)
We are noticing some differences between the data entered on the data entry screens and the output from the pivot tables. We also have a similar indicator for the KP program but with KP types as additional category option combos. We also created an indicator for TX_CURR that combines the 2 data elements.
Here is the issue we are having and cannot figure out why.
For instance a facility reported its total current on treatment for September 2018 as 202. 202 is what shows as the total on the data entry screen for the data element. Kindly note that September is the last month in the reporting period using financial October (FY).
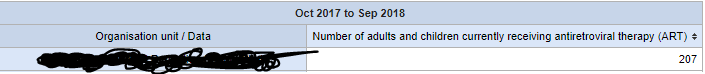
When I run a pivot table using the Fiscal Year (FY) as the period, we get a value of 207
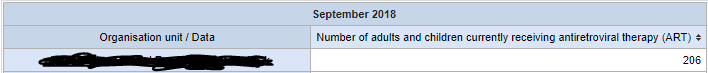
When we change the period to September 2018, the value changes to 206
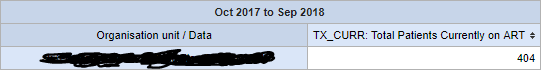
When we use the indicator TX_CURR and the FY (October 2017 - September 2018) as the period, the value changes to 404.
When you look at the indicator and data element side-by-side, this is what you see

This is causing some confusion with our facility staff, especially when they have to do their monthly reports.
Has this been reported before and what can we do to resolve this?
Has anybody else encountered this? What may be causing this?
Your help is most appreciated.
Regards,
Ifeanyi