Discovered another issue while migrationg to 2.30 from 2.27 in the data visualization tool. On 2.27 we were able to select data element groups that are data dimensions and what the graph does is that it summarizes or aggregates the values contained in the data element group selected. Now on the 2.30 apparently that is not possible any more, the moment you update the graph it gets stuck and it has been imposible to make it work. Apparently 2.27 version is more flexible with this. Anyway if anybody knows a way around this issue please let me know. Thanks
1 Like
Hello @jgaf1980
Did you run the upgrade script for 2.29 or perhaps you just did direct to 2.30? And what do you it gets stuck? The Visualizer app stops working or you cant get the desired result?
1 Like
Hi Moses,
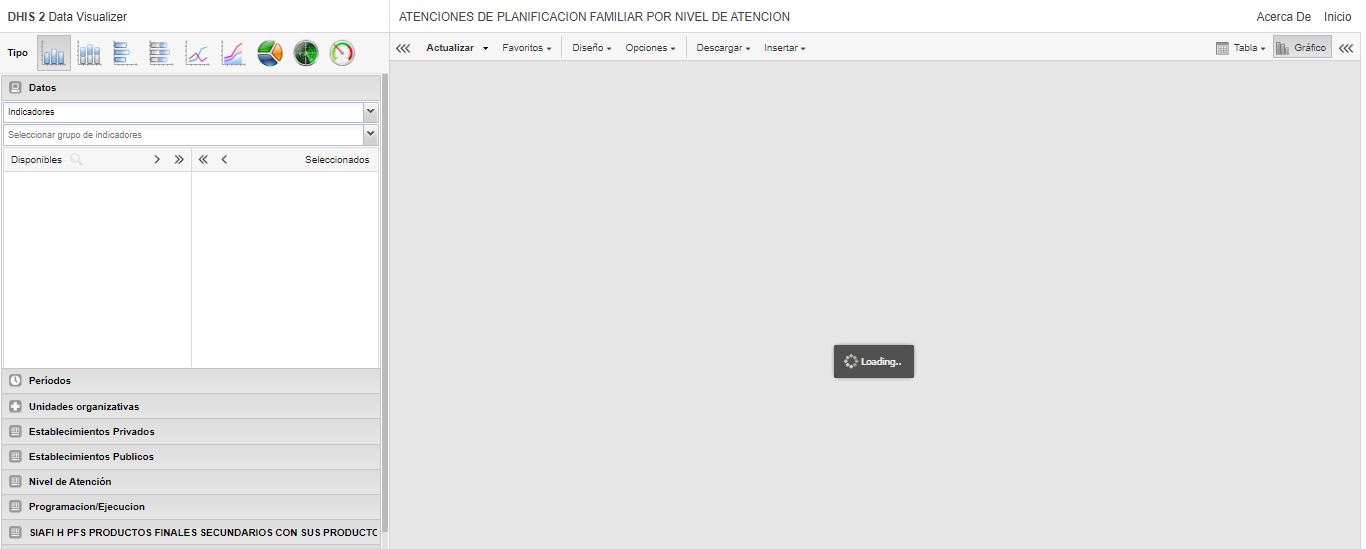
Thanks for your replies, actually we did ran the script for 2.29 to migrate from 2.27 to 2.30. And the visualization app keeps on loading without showing the graph, this only happens when you want to se information directly filtered by data element groups that are data dimension in the app. If you select data elements it runs as expected. The idea of filtering directly this data element group as dimensions is to consolidate the aggregate data of the data elements belonging to specific data element groups, without adding every data element to the filter, like I said this worked perfectly on 2.27.
1 Like