Hi all,
Is it possible to import point data into DHIS 2 separate from the OU hierarchy? We would like to visualize various community structures “in the background” (condom distribution points, schools, religious establishments) but we don’t want to clutter up the OU hierarchy with locations where we won’t be collecting data. They would just be labeled points that we could then layer data over. I see you can do an external layer - it that basically just a picture and would that serve our purposes?
Thanks for any creative ideas on this!
~Natalie
Hi @Natalie_Tibbels,
Great question and feature request.
In DHIS2 JIRA (where all features and bugs are recorded), we now have an issue type called “User story” which is a way for users to request features without perhaps knowing how it should be implemented in a more technical way. I took the liberty of translating your question into a user story here - please feel free to add on if there is anything you’d like to add or clarify. The DHIS2 product manager for Analytics/DQ (@Scott) will in time review it with the team and decide whether to implement something to solve this user story (or maybe it is already solvable through DHIS2’s many functionalities).
I am also tagging one of our GIS developers - @austin - to see if he has any immediate creative ideas to your request.
Best,
Karoline
@Natalie_Tibbels Thanks for the user story. We agree that there needs to be a more flexible way to represent various low level geographic objects or service delivery sites without having to clutter up your org unit hierarchy. Keeping a clean and organized hierarchy is critically important. We have a could of things in the works and are even starting to explore multiple hierarchies, but that will be a while before that is implemented.
A couple of creative ideas. If you have continuous programs at these sites, you can use tracker to track condom distribution points. These can be put under the org unit that makes the most since (district or facility). If you have periodic updates to these sites then you can make a simple, single stage which repeats. The tracked entity (condom distribution site) can be associated with a point or a shape, also each individual data capture event can be associated with a point. These can then be displayed in the maps app.
If your distributions are more like single outreach events, meaning you are not collecting longitudinal data on the site, you can more simply capture each distribution as an event. Events are also able to be associated with a point and can be displayed in maps.
Happy to explain in further detail if you have more questions.
Thank you!
Thanks! Yes, right now we have them as TEIs - which is helpful for a few structures where we collect annual data for example (enrollment for schools). But a lot of structures we just want to exist. ![]() And it’s less even about how they show up and more about importing. The datasets exist and are ok - they have the name of the structure and the coordinates - but going through 1000 points and guessing which OU it should be in and assigning it the UID of the OU is prohibitively time consuming and doesn’t add value to the analysis. And I think bulk importing TEIs is also a big pain/impossible through the UI? Anyway thanks for looking into it!
And it’s less even about how they show up and more about importing. The datasets exist and are ok - they have the name of the structure and the coordinates - but going through 1000 points and guessing which OU it should be in and assigning it the UID of the OU is prohibitively time consuming and doesn’t add value to the analysis. And I think bulk importing TEIs is also a big pain/impossible through the UI? Anyway thanks for looking into it!
Sure thing. Sounds like you have already worked through many of the problems. @prosper or @John_Francis_Mukulu and his team in Uganda have been working on a TEI import application that may make it easier for you than going through the classic Import/Export App.
Thanks @Scott for copying me in the trail.
I guess @Natalie_Tibbels you have an event or program stage that has coordinates and want to import these point coordinates to the stage? If am write them you can use our Data import app (tracker and aggregate)
The use-case we have an integration of a dhis2 case based surveillance tracker with a repeatable stage picking data from a custom specimen tracking app that automatically captures the coordinate of the location of of the specimen and the data import app
The app imports data to the stage including the coordinates.
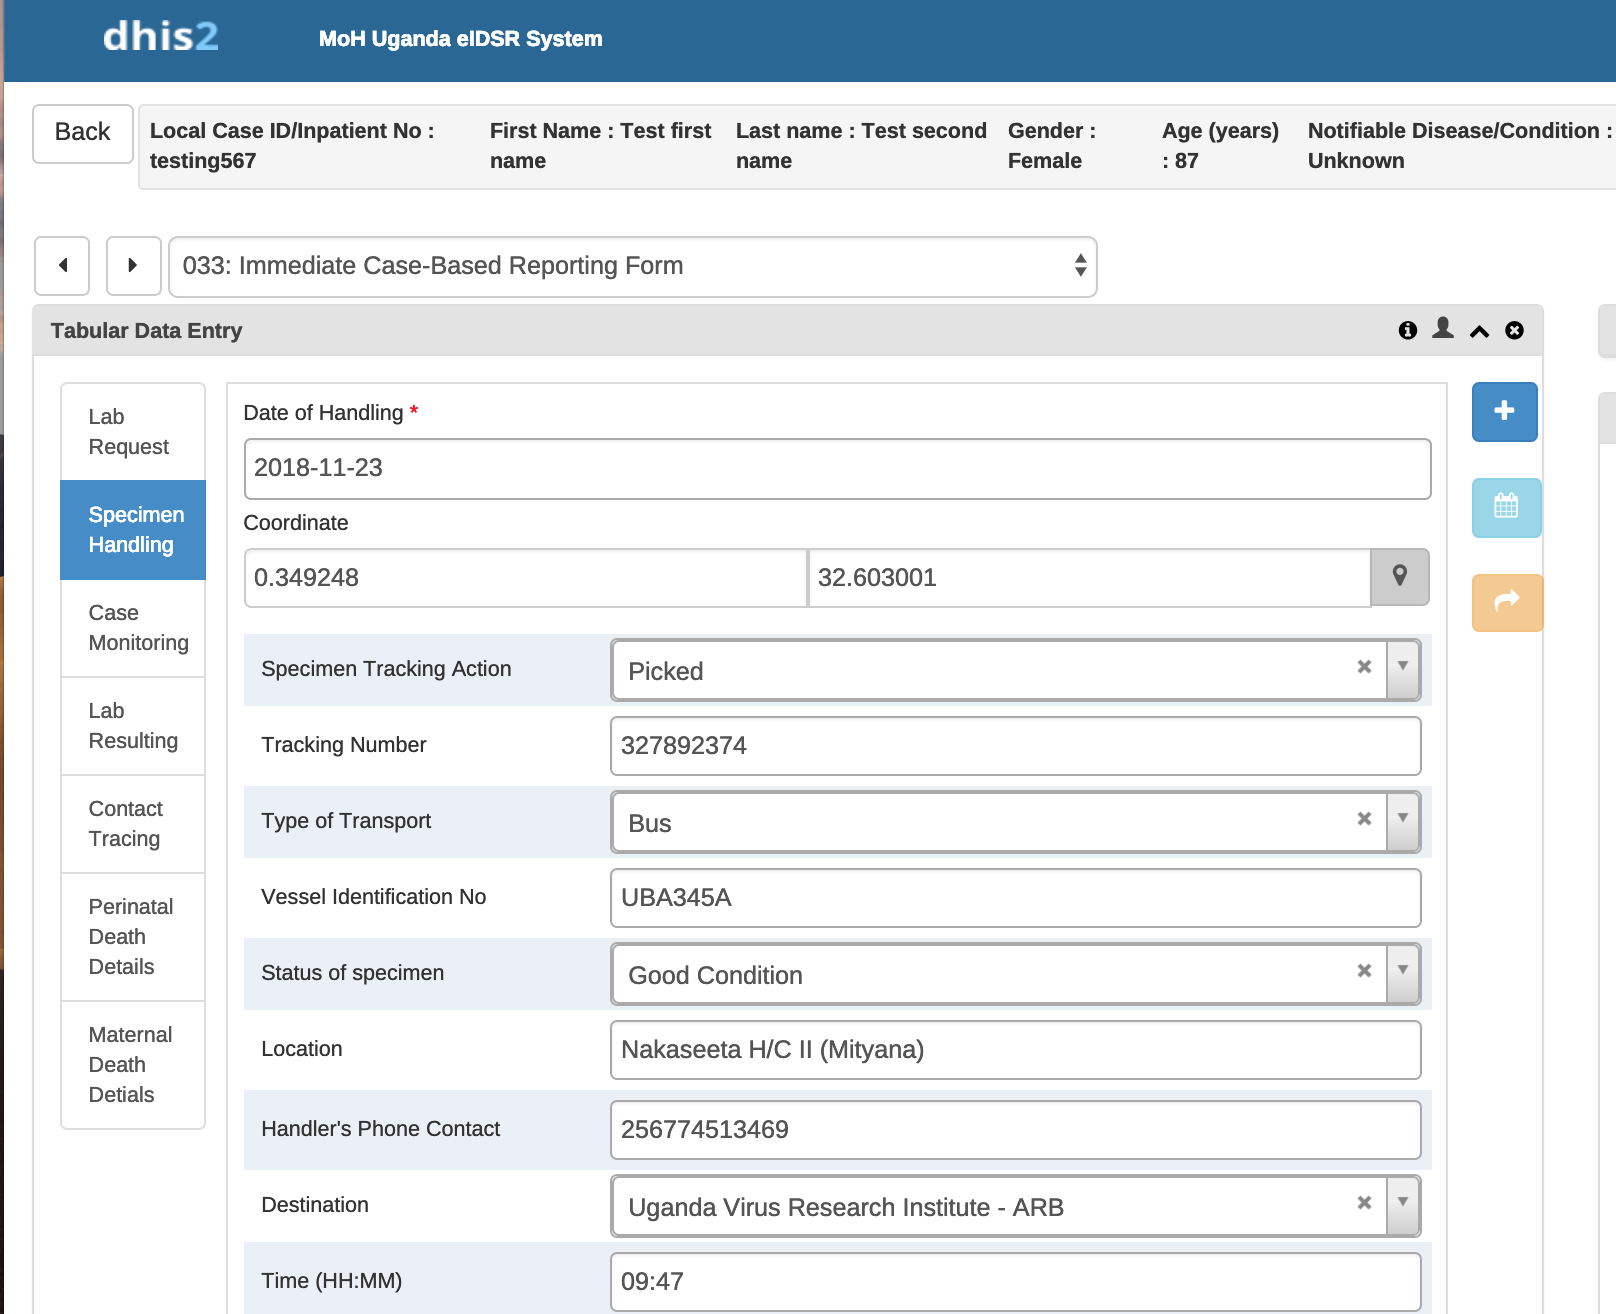
Note: Remember if you want to visualize this data in maps as points in events, you will need to have the stage coordinates
If this is what you are interested in we can share the data import app with you.
Regards