I have a data set that collects information about the number services given on a day and the price charged for the services. The price charged for the service can change on a daily basis. I have created an Indicator that calculates the amounts of services given times the price of the service. It works nice on pivot tables when the period is daily, but if I change the period to monthly, the system calculates the indicator based on the last price given on that month. This makes a significant difference between the total when I sum the indicator on a daily basis from the monthly aggregate value. The service data element has an aggregation type SUM and the price data element has anaggregation type NONE, I have it this way because if it has an aggregation type SUM the monthly values multiplies the sum of services times the sum of all the priceces and the result goes way high.
I hope I explained myself with this issue, if anybody has any idea on how to make this indicator run on a monthly period I will appreciate it.
Hi @jgaf1980, This is an very interesting use of indicators. What do you want the aggregated monthly indicator to be exactly? I guess you would want it to be a sum of all of the individual daily calculations correct?
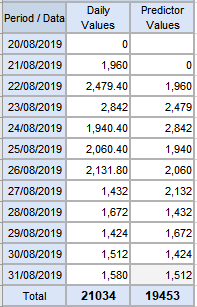
If that is the case, then I suggest that you make a predictor that multiplies the price by the daily service cost. First you’ll have to make a new data element to store the predicted values and set its aggregation to SUM. The generator of the predictor would probably be something like: SUM(services*price). Your period would be daily, sequential sample count would be 1, annual sample count 0, and your org unit selection would be the org unit level where the data is captured.
Hi again Scott, I tried the predictor solution you proposed, it almost works, it accumulates the data and it sums the indiidual daily calculations, but since it works from information from the day before the monthly aggregation is missing the last day value, wich will appear on the first day of the next month. Since the report has some financial purposes I need the full month data. Is there any way I can make the predictor to aggregate the values including today data input, so i can have all accumulated all days in a month.