I have few questions to ask regarding new Line listing app.
As I understood from number of posts the Event reports app will not be maintained anymore in future DHIS versions.
After upgrading DHIS from v.2.36 to 2.40 I could find only few or some reports fin Line listing app created on Event reports app. Moreover some of them just doesn’t show any data
although the same report in Event reports works perfectly fine…
Plus another question: what gonna happen to the pivot table reports? Where and how we can get them? For example in order to build the same multi leveled pivot table in Data Visualizer there must be produced big numbers of the PIs with options combinations?
Thanks for the post. There are many things to look into from your post - it’s quite helpful when each separate point is addressed into different topics so don’t worry about creating more than one topic. However, I would like to comment on each point one by one and hope it’ll be of some help.
Yes, indeed the development is focused on the Line Listing app and not on the Event Reports app; however, the app still works in the latest versions of dhis2 although whenever there’s an issue, the recommendation would be to use the Line Listing app.
Please note that the Line Listing app is backward compatible, as the docs says:
NOTE
There will be a forward compatibility with the Event Reports app, which means that you can open the existing event reports of type line list in the Line Listing app, but you cannot save them with the same name in the Line Listing app.
You mentioned that they appear in the Event Reports app perfectly fine, is that in the same instance you upgraded to (version 20)? If not, are you able to find the data in the database?
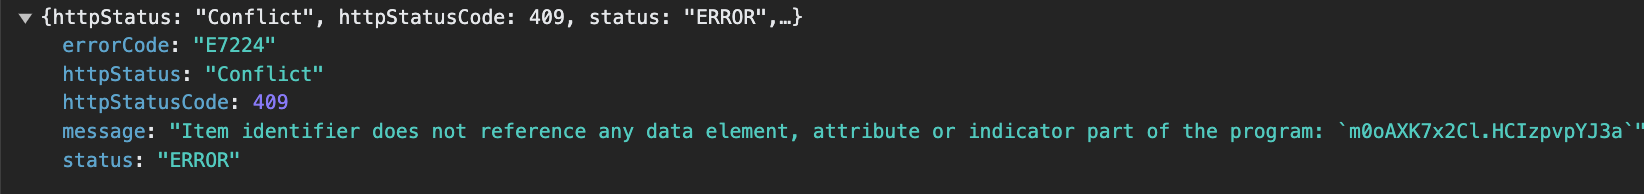
For the reports that don’t show data and the reports that return errors, could we get the Network requests and responses? Additionally, regarding the reports that work in the Event Reports app and not the line listing app, do you think you could reproduce the issue for at least one example in play.dhis2.org this helps with deriving more info and reproducing it as a bug?
Could you please explain further about a pivot table that can be created in the Event Reports app and not the Data Visualizer app?
Thank you for your response.
I want to provide some explanation to your question:
Could you please explain further about a pivot table that can be created in the Event Reports app and not the Data Visualizer app?
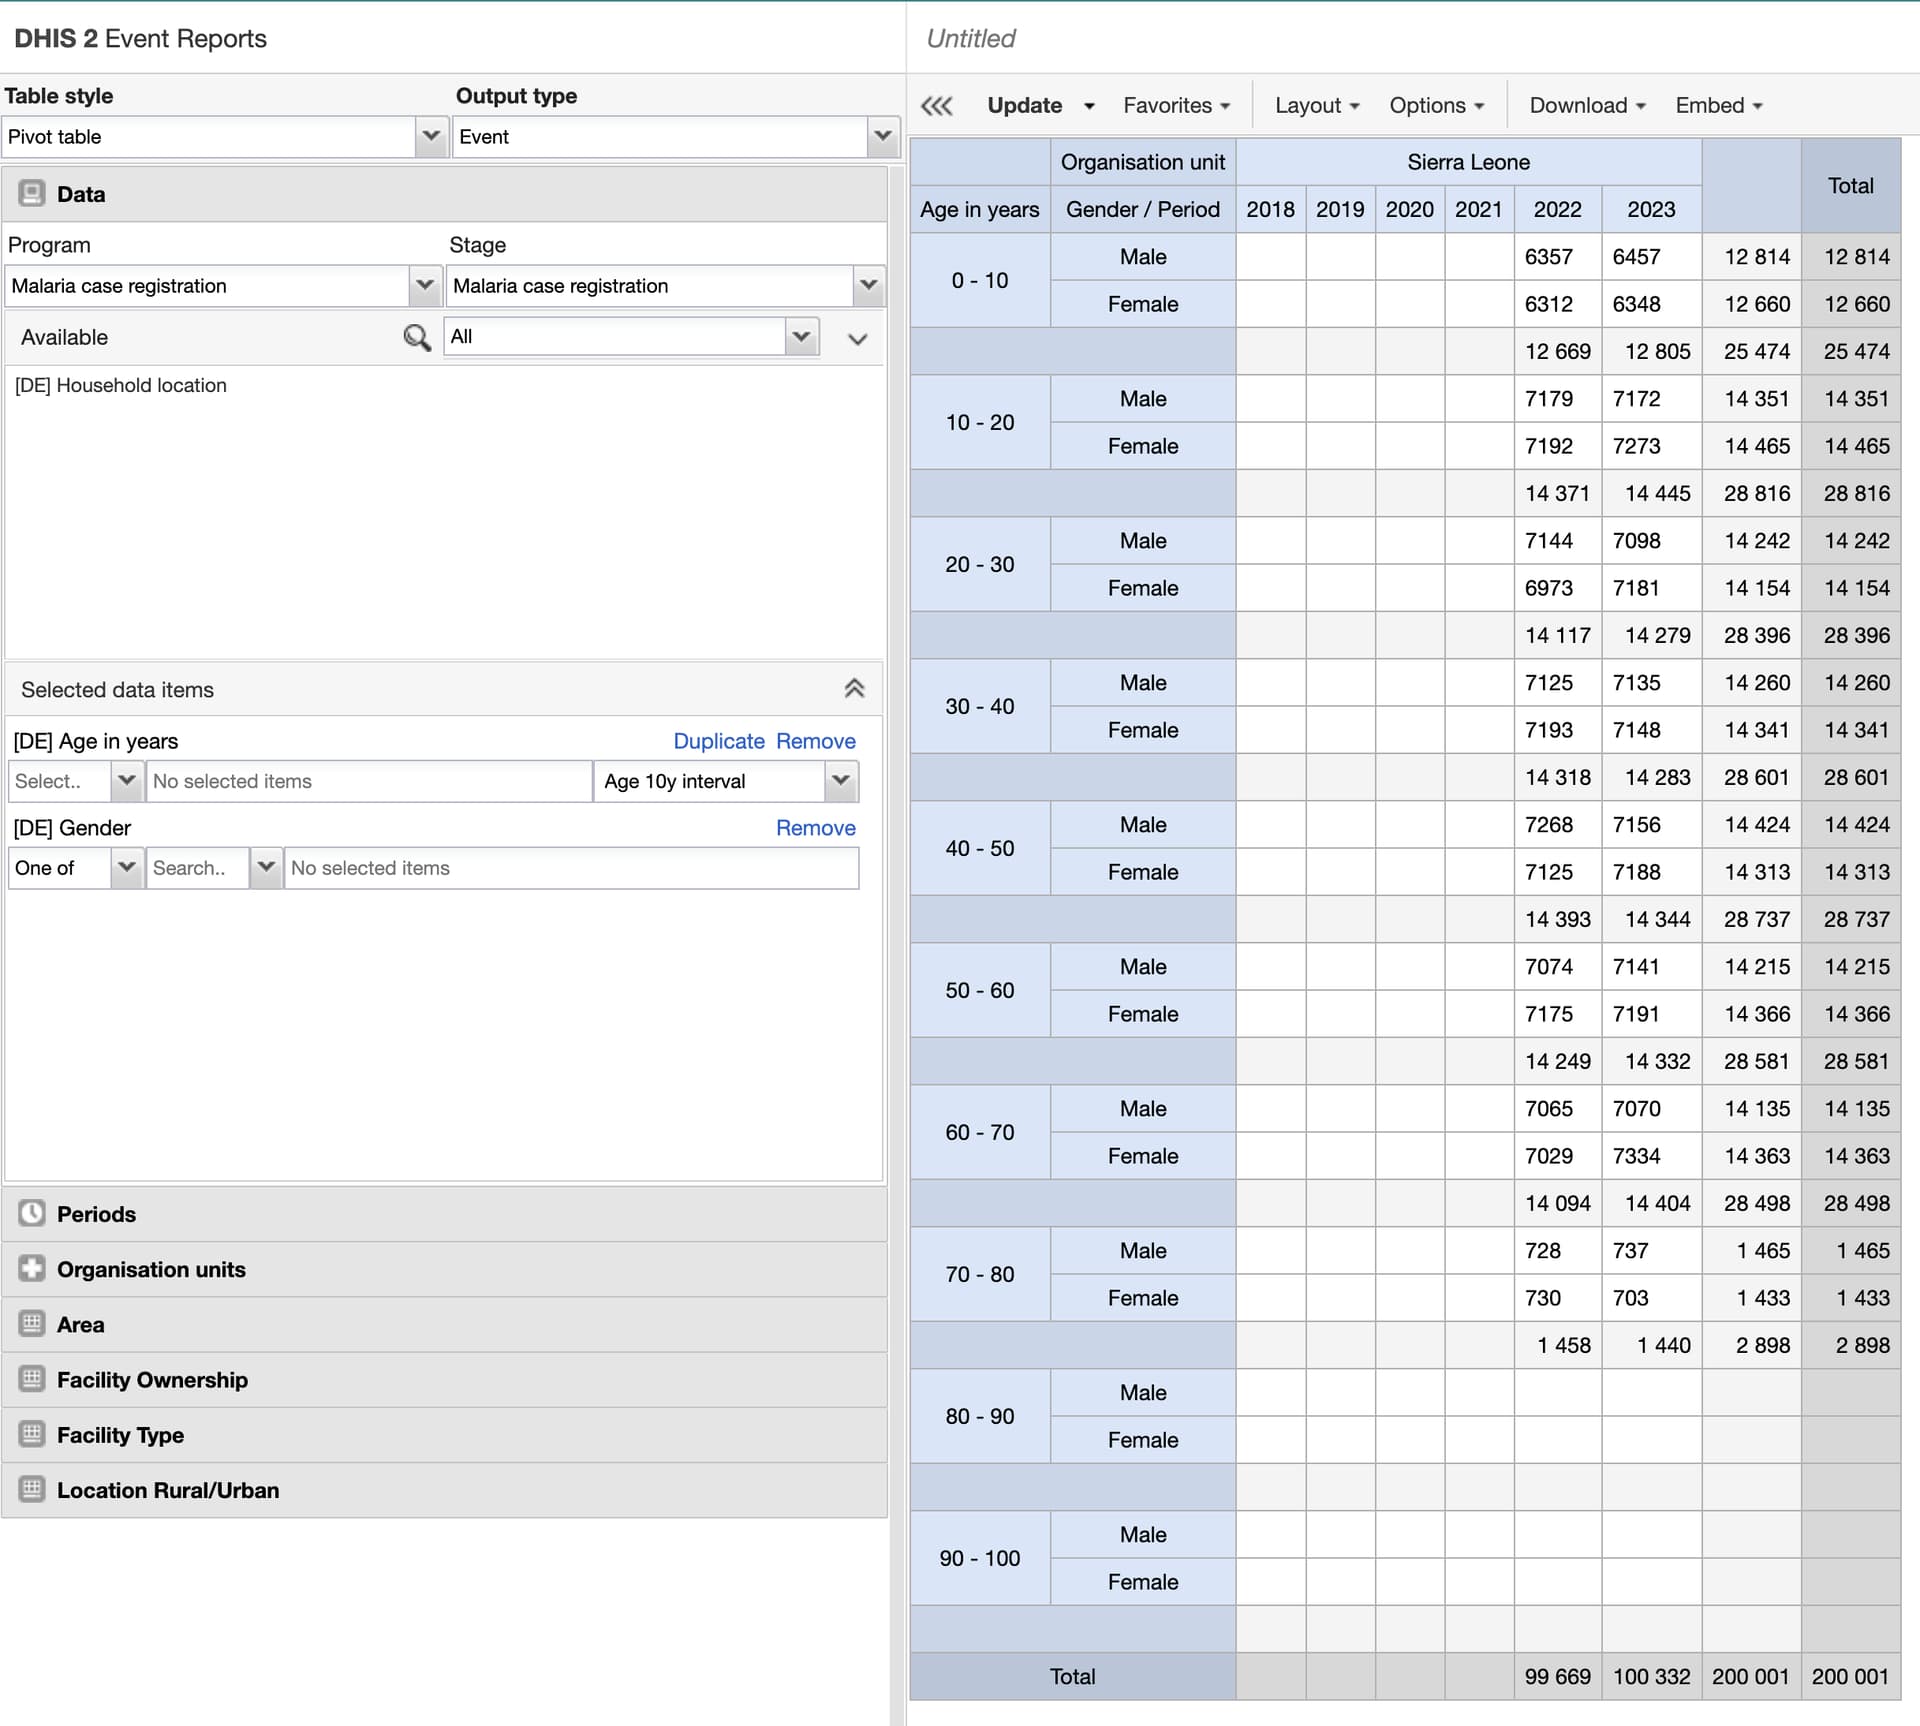
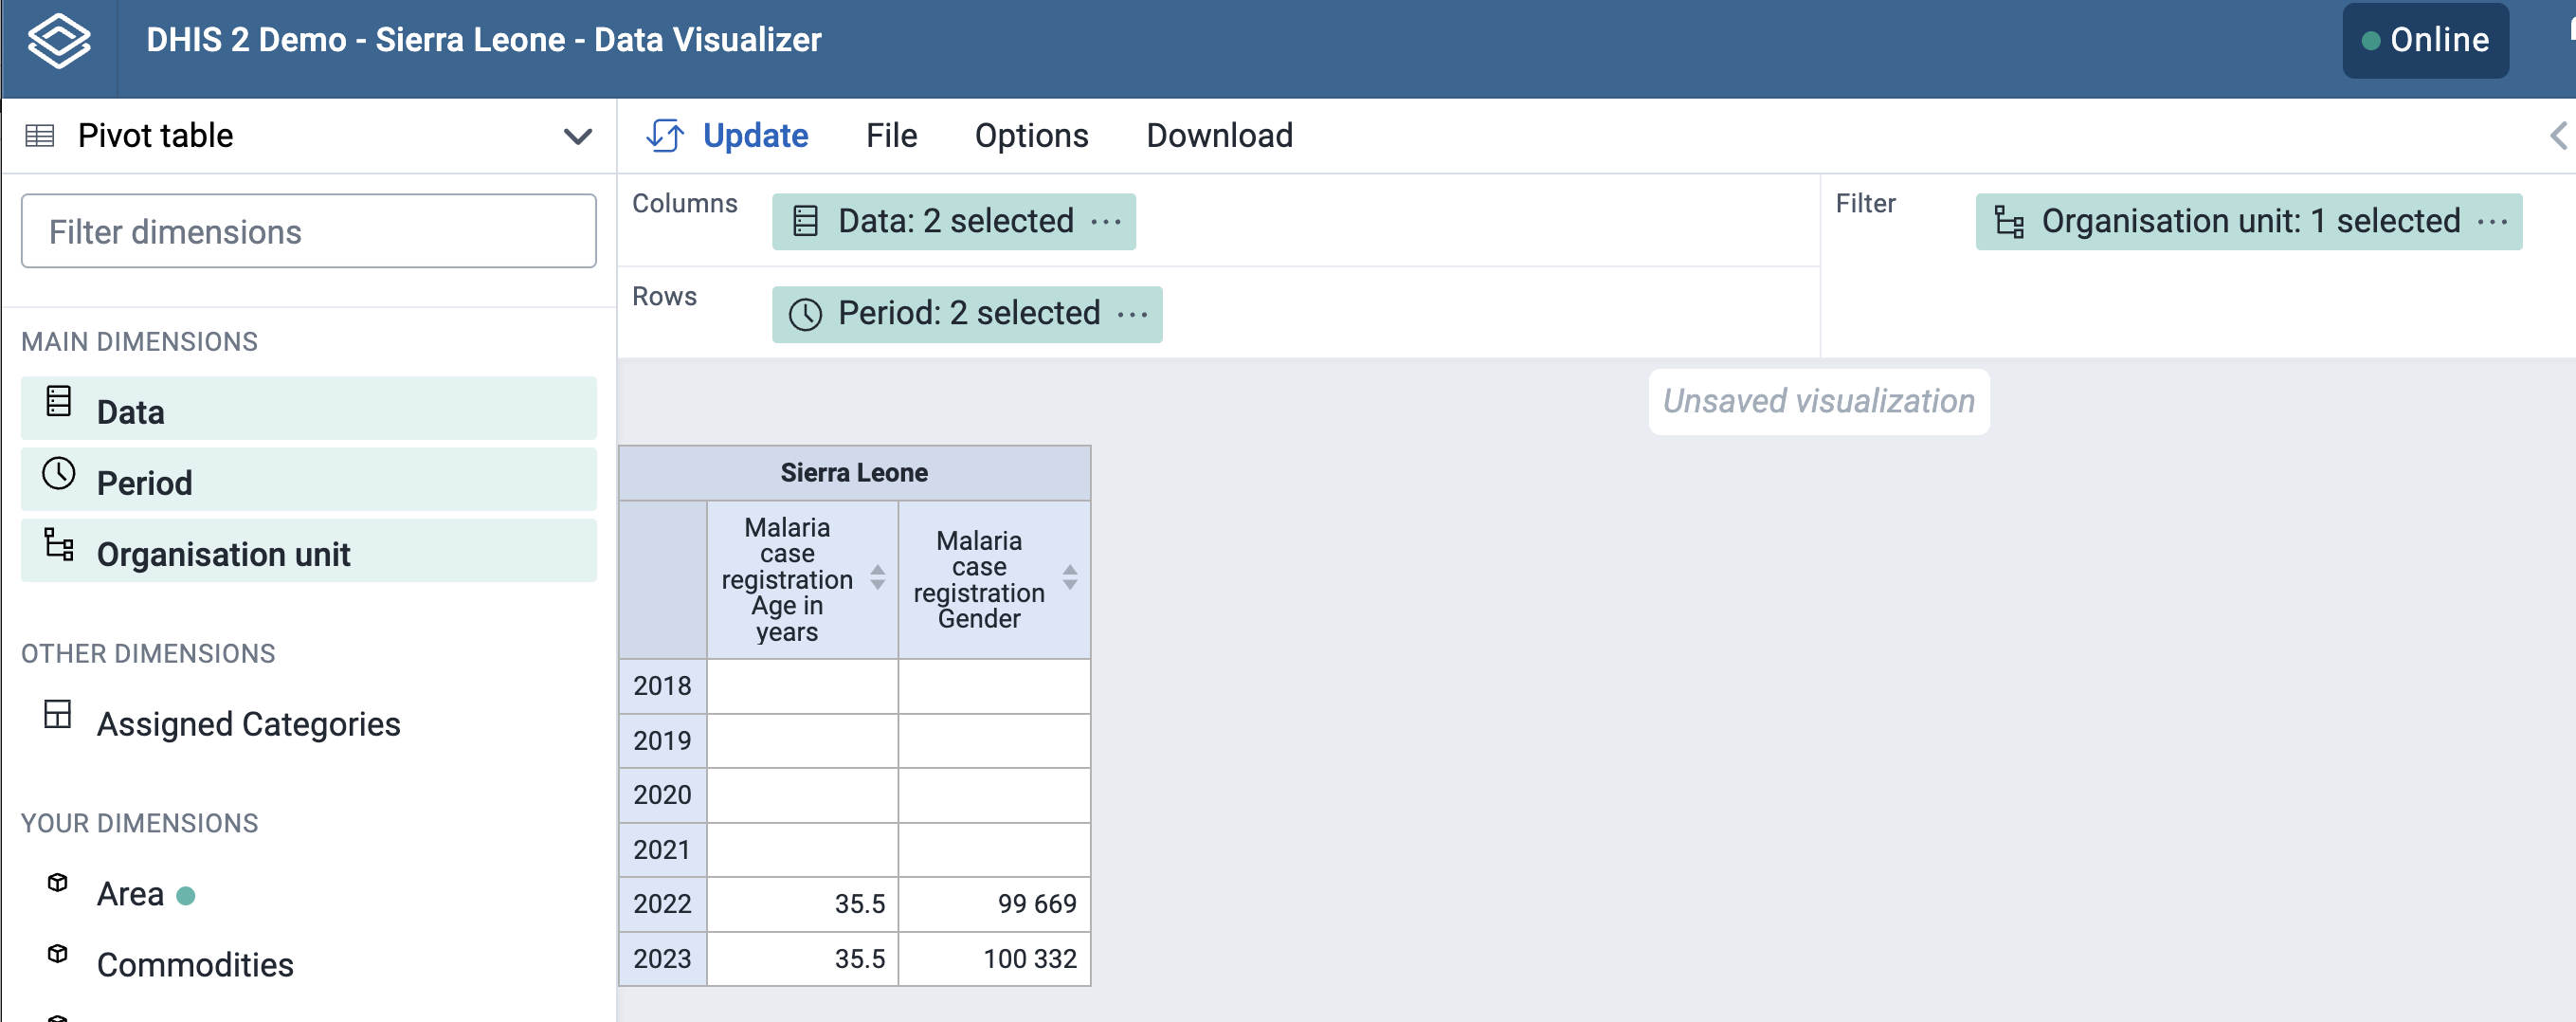
Suppose you need to produce pivot table, where you need all age groupd and genders to be displayed in one pivot table. For example I took Malaria case registration program, report periods: this year and last 5 years, for Sierra Leone.
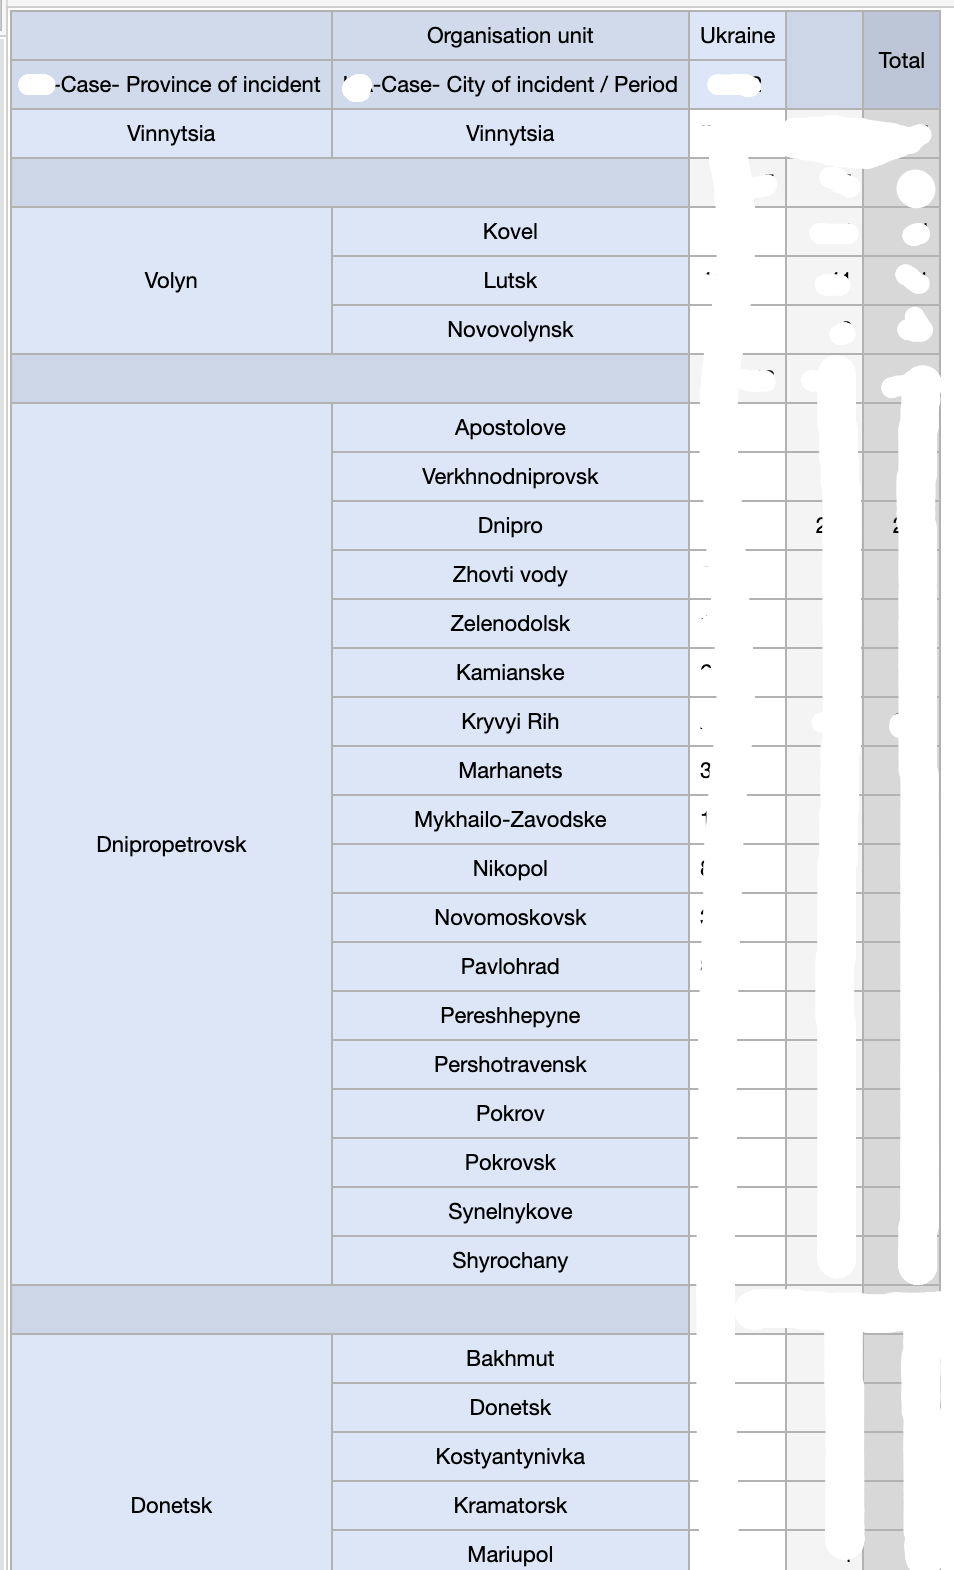
Event report pivot table can produce following reports
So in other words, to produce the same pivot table as Event reports can produce, you need to create 20 program indicators, 10 Age groups multiplied by the 2 Gender groups.
So would be great somehow to have option in Data Visualizer to indicate that the data fields should be treated as multilevel nested fields.
Or maybe I have not enough knowledge how to properly use the app.
Anyway will be grateful anyone who can provide more information on usage of Data Visualizer app.