I’m currently working on a dashboard that displays validation checks using visualizations. Here’s an example of one of the checks I’m implementing:
Validation Check:
Number of suspected malaria cases == Number of malaria cases tested + Number of malaria cases referred
To perform this logical check in a visualization, I’m using the following equation:
1 / (((x - 1)^2) * B + 1)
Here, x is a fraction where the numerator is the Number of suspected malaria cases and the denominator is Number of malaria cases tested + Number of malaria cases referred. When these values are equal, x equals 1; otherwise, it takes on a non-zero value.
The constant B is a large number that ensures the result is approximately 0 if the values don’t match. When they do match, the squared term cancels out, resulting in a value of 1.
This approach seems a bit complex for a straightforward logical check, so I’m wondering if there’s a more efficient way to accomplish this in a dashboard, potentially using a different tool or functionality. I looked into the interactive scorecard, which changes colors based on values, but I need additional flexibility to calculate pass rates and perform other operations on the data.
Does anyone have suggestions for achieving this in a dashboard, or would using Python or another tool be better suited for this task?
Would you share more about the use case? What you are describing seems similar to using indicators and thematic layers but they’re not ‘on the spot calculations’ as they need to be configured before being added to the dashboard.
Sorry, I need to ask to understand this point better. Do you mean to perform operations on the data when it’s already added as favorites to the dashboard?
Yes, the goal is to have a dashboard that provides an overview of data quality across an organizational unit. I’d like to display whether a districts, facilities, or CHWs is passing specific validation checks, as well as overall compliance rates—for example, the percentage of CHWs passing a particular check.
What you’re describing sounds similar to using indicators and thematic layers. However, these aren’t real-time calculations; they need to be configured before adding them to the dashboard.
That’s my question—Is there a way to perform calculations or logical checks to generate a plot, or are you limited to pre-configured indicators?
Do you mean to perform operations on the data after it’s been added as dashboard favorites?
Not entirely, I would like to perform operations on the data and display the results in a DHIS2 dashboard.
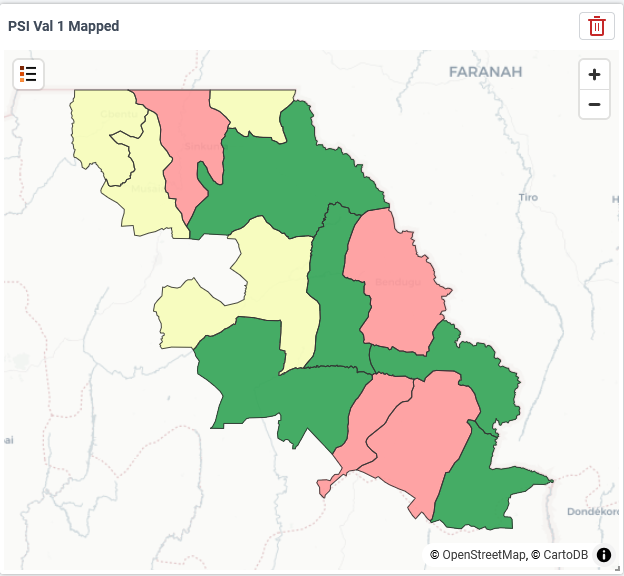
I think I’ve identified the issue. I’m not a super user and don’t have access to data management to create pre-configured indicators, which includes the option to add logical functions. Therefore, the solution above provides a way to mimic this function by using the calculation feature in the data visualizer app. This allows me to create visualizations that I can then add to my dashboard. Here are a few examples of what I’ve been able to accomplish:
One limitation with this approach is that it only runs the check for the current organizational unit. As shown above, it assesses whether the CHW in the table meets the validation check. I haven’t found a way to sum results for lower levels within an organizational unit, such as getting a count of CHWs passing each validation check per Facility or Chiefdom. If anyone has ideas on how to achieve this, please let me know.
Hi @Jake_Lamers, nice to see this kind of analysis in DHIS2. As an RPCV who worked on DHIS2 myself during PC it’s also nice to see PCVs innovating in the platform.
We’ve recently published new data quality guidance that is similar to what you are aiming to do. It might be helpful as a reference.
To get the count of CHWs first try to use the subexpression indicator expression. If that doesn’t work then you can make a predictor that does the same, albeit a more complex approach.
If you want schedule some time to chat through it more then send me an email, scott@dhis2.org