Issue : There was a problem loading this dashboard item

Hello,

I’ve the following error with my Dashboard.

In the Data Visualizer app, the Analysis is working well.

Here are errors in the browser console

NB : There is no error in Network Tab.

I’m using DHIS2 2.34

Regards

1 Like

Hi @didate,

Please run the analytics tables export first, and then I’m sure you tried to clear the cache but could you double check using a different/new browser/profile? If you don’t see the issue in the new/different browser/profile then it’s 100% cache issue. If you still see the issue then we need more info.

I know you said the Network tab doesn’t show errors but what about the Catalina.out log? Please share it without the sensitive info if there are any WARN or ERROR then it might help for sure.

Also, would you please test by creating a new dashboard and adding only this item? Do you still see this issue? Maybe while on the new dashboard with this item, open the network tab and refresh the page, would you check the request and response for this item in the Network tab?

Thank you!

BTW, what is the version of the DHIS2 instance that you are using? :slight_smile:

Hello @Gassim

Thank you for your reponse.

I’ve cleaned the cache, tried with others browser, but I don’t know what really happen, sometime it’s working, sometimes it isn’t. Also there no error in the catalina.out.

I’m using DHIS2 version 2.34

Regards

Maybe it’s a cache issue. Whenever it’s not working please immediately check if the issue persists in a clean/new/different browser/profile/guest mode (which you’ve not visited the instance in before) if the issue is gone then it’s 100% a cache issue.

If it’s not a cache issue then the only way to figure out is by testing. Try to make notes on how to reproduce this issue. Additionally, if you have a test instance that you could give access to maybe this will help as well.

Thanks!

Hi AL Gassim
I have the same problem ,there are some charts hide and appear .However I run the analytics tables export and cleared cash app and browser
In the data visualizer app,the Analysis is working

1 Like

Hi @abdulmajid

Which version of dhis 2 are you using ? 2.34 ?

1 Like

Welcome to the community @abdulmajid! :tada:

Yes, please as @didate asked, which dhis2 version is the instance you’re using?

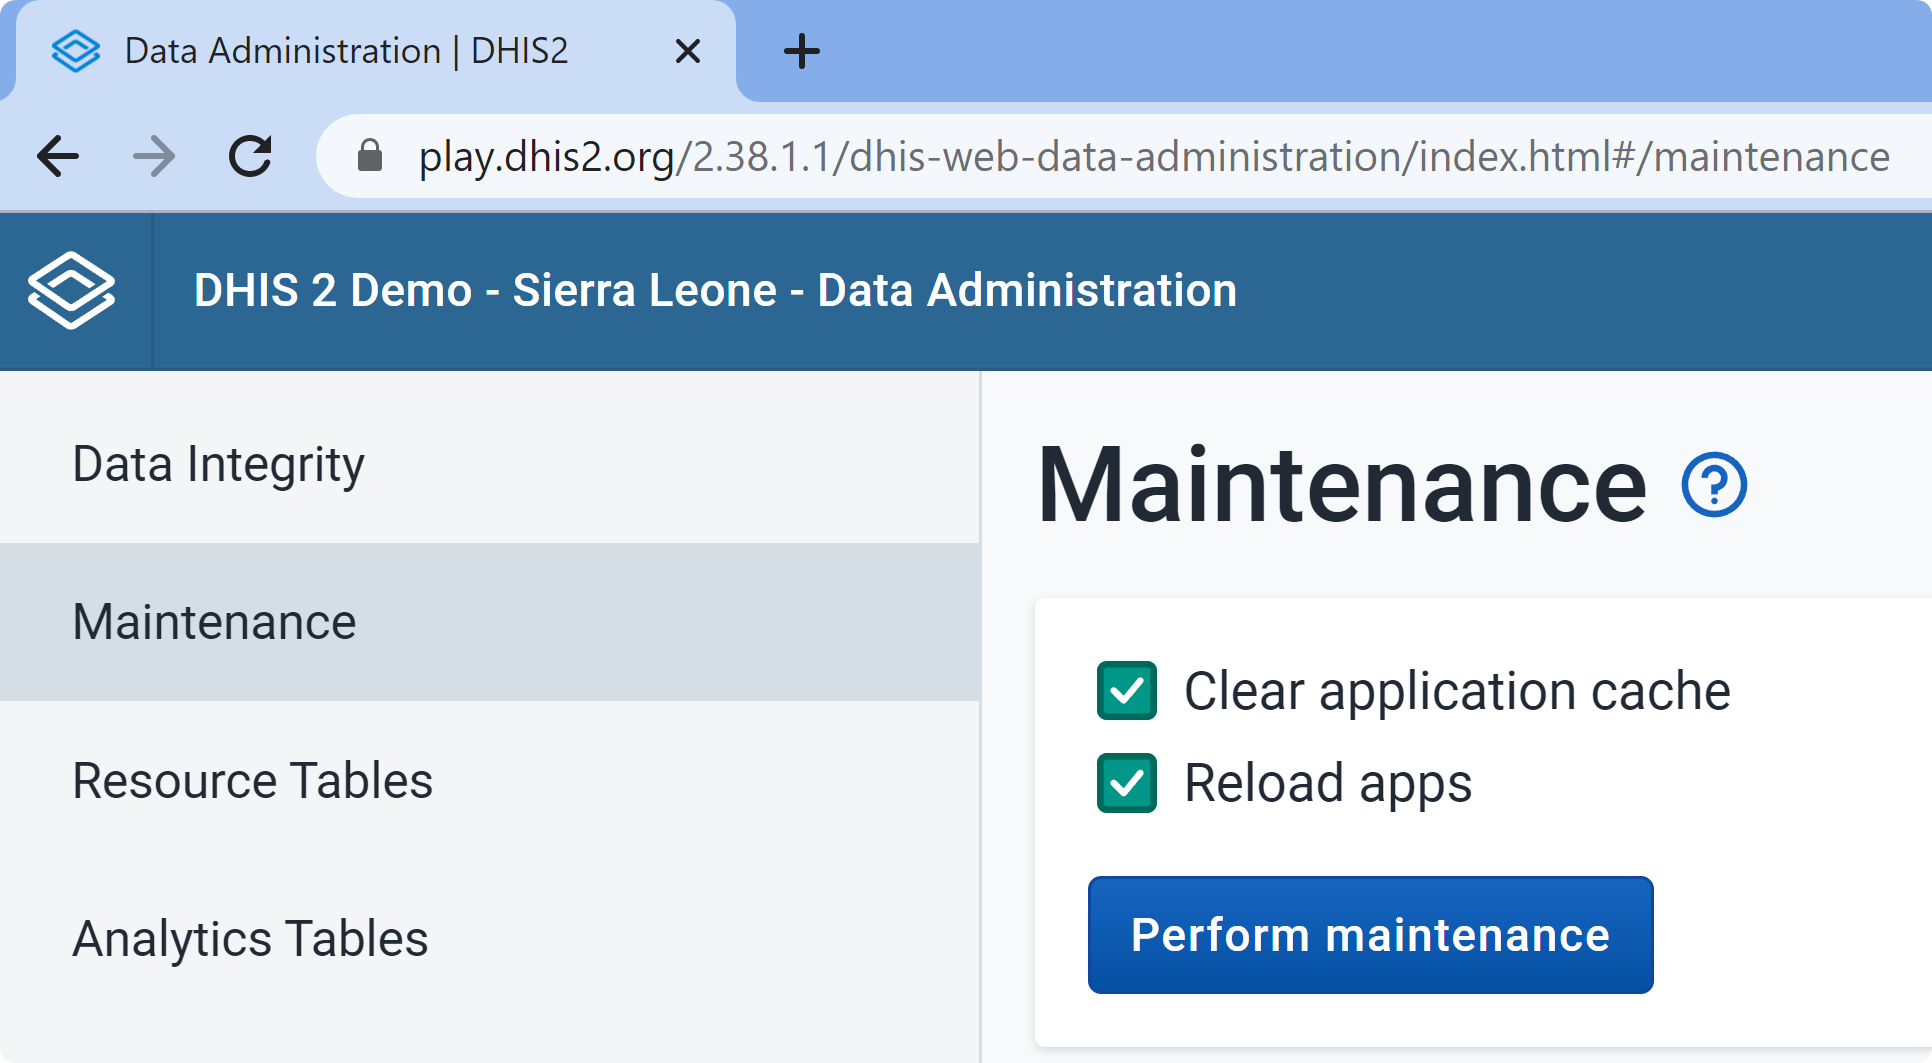
Please try to clear the cache using Browser Cache Cleaner app as well as from the Administration app → Maintenance → select “Clear application cache” and “Reload apps”

Before you open the dashboard you might also want to try the following options:

If you still check this issue in a new/different browser/profile (or guest mode) and still see the issue then please check the Network tab (DevTools F12Network tab) if there are any errors and share here, thanks!

Thank you didate and Gassim
I am using the version 2.34.7-EMBARGOED
I applied your instructions on Firefox browser and there is no error ,but on Chrome and Microsoft edge browsers does not work.so some Charts,maps hide ,appear and sometimes all work well.

Thanks

@Gassim may be it’s a bug on the 2.34.x versions ?