As we have indicators and program indicators on dashboard, which are not loading complete on dashboard, it always spins, every time i refresh.Do we have any solution for this issue?
Thank you for the post! It’d be great to check if there are any errors in the Console and Network tabs of your DevTools.
What about empty cache and hard reload? As well as clear application cache and reload apps from the Data Administration app → Maintenance .
Thanks!
There is no change clearing the cache,Does DHIS2 tracker computes indicators value in every browser refresh?It takes about 5 to 6 mins to load the indicators value in Dashboard.There are about 20-25 favorites save in a single dashboard
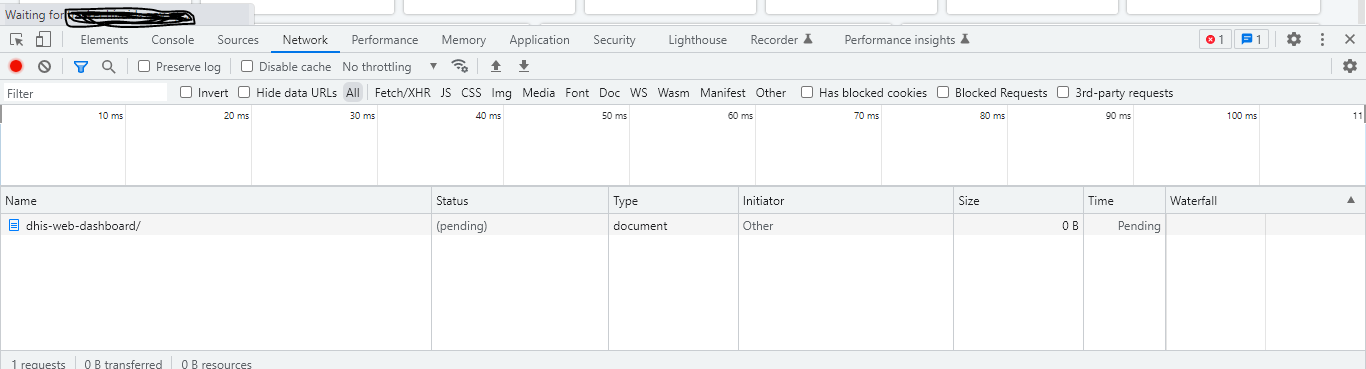
Please login using the browser’s Guest mode (not incognito), and open the DevTools in Network tab (F12 → Network), refresh the page and take a screenshot. I will triage this with the software team. Thank you!
1 Like
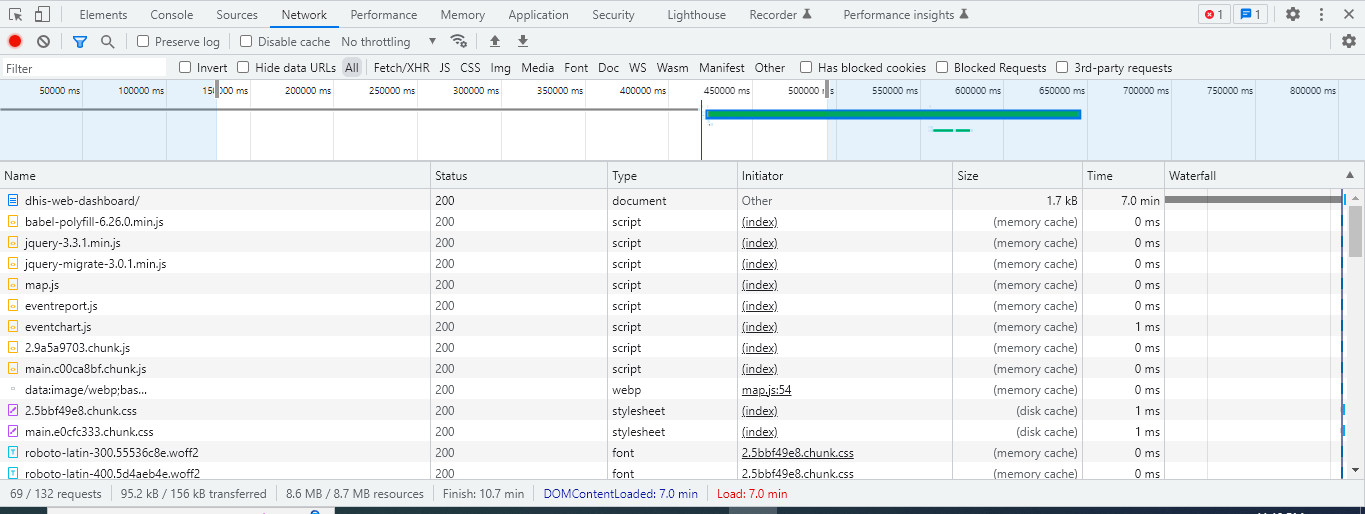
Thanks @Roshan.Konda , this is still Pending, could we get a screenshot after it finishes the download. Thanks!
@Gassim , It doesn’t finishes loading, it will take more than an hour to finish sometimes it doesn’t loads at all and browser crash.I will wait for the finishing the downloads.
Please share the version number of the instance you are using (very important info) ![]() And maybe other info about the infrastructure…etc that could help understand the issue.
And maybe other info about the infrastructure…etc that could help understand the issue. ![]()
Thanks!
@Gassim, I am using version DHIS2 Tracker 2.34 and architecture is application and database are in same server postgres9
Hi @Roshan.Konda,
I’m sorry you are having trouble with performance on DHIS2. I have to point out that you are on an old unsupported version now, so you should have an upgrade plan in place in order to take advantage of improvements and security fixes; the last stable version was 2.39 and v40 will be released imminently. We will stop supporting 2.37 within the next month, so I would encourage you to upgrade to the highest version you can.
We made some significant improvements in 2.35 onwards, and also introduced some guidance for reducing or avoiding performance issues: Tracker performance at scale - DHIS2 Documentation
I hope that a combination of upgrading (if you can) and following that guidance will help you get the best performance out of your system. The guidance document also has a little bit of information about how to monitor the server when it is struggling with performance issues: that may help you understand a bit more about why it is not returning the dashboard analytics.
I’m sorry I can’t offer a quick fix, but I hope the information above helps.
Kind regards,
Phil
1 Like
Hello @phil , we have all the hardware required recommended on Tracker performance at scale - DHIS2 Documentation
but due to the legacy data, migration limitation, we have not migrated to new version.The new version has some limitation with the boundary rule.So that is the major barrier for migration.
Thank you.
Could you add more info about this challenge you are facing and best if there are screenshot? Thanks!
Hello Agan @Gassim
we have already posted on JIRA for issue [DHIS2-14178] - Jira progress has not been posted yet.
Thanks @Roshan.Konda! The issue has a fix which is to add a “dummy” boundary for the Enrollment Date as @Markus suggested; furthermore, I’m not sure if this issue exists in all the versions as the ticket is set only to 2.38
It would be good to use an instance other than the production instance and upgrade to a higher version to test. ![]()
Hi @Roshan.Konda would you mind elaborating on the issue with program indicators and the enrollment period boundaries, and if this is still an issue for you?
On the issue of dashboard performance, this has consistently been a problem with HIV Case Surveillance trackers that achieve large scale (including the HIV CS toolkit). I would recommend that you consider a tracker to aggregate pipeline, where program indicator values are periodically saved as aggregate data element values. Program indicator values are calculated “on the fly” when queried —including when dashboards are loaded by end users—which can create a lot of stress on the server. A tracker to aggregate pipeline ensures that dashboards are analyzing data element values, which greatly improves performance.
Please read our documentation on Tracker and Aggregate Data Integration
In version 2.39 this is a Data Exchange API to support the tracker to aggregate pipeline, and in version 40 there is a DHIS2 Data Exchange app which uses these endpoints to support pipeline configuration. I understand migration to higher versions may be an issue due to legacy data migration, but this may be one option to look into long term.
1 Like