Hi Riddy,
Why don’t you just use a data element (e.g.“Population”), assign it to the facility with a dataset, and either enter or import the population figures for each facility?
There are a couple of steps to this process depending upon the data you have available and the approach that you use for calculating the different denominators.
Decide whether you will only store total catchment population for each facility and then use national level percentages to calculate specific service target populations. For example in Rwanda we multiply total population by 4.1% to estimate the expected pregnancies and 23.6% to estimate the women of reproductive age, etc… If this approach works for you then you only need to create a single data element “Population” and the rest of the target populations can be calculated as indicators. You can also use the ‘Constants’ feature in data administration to define these percentages so that you can change them easily.
Normally the facility target populations don’t add up to 100% of the national population, so you will probably want to add official census projected populations at the lowest level that they are available. Note for your data element you should define 2 aggregation levels for Population. In our case they are Facility and Sector. All of the higher levels are automatically aggregated.
If you have the estimated target populations for each facility in a spreadsheet, you can import them into the datavalue table (normally you import one record per year per facility so make sure you get the periodid, dataelementid, and sourceid=organisationunitid fields correct) before appending them.
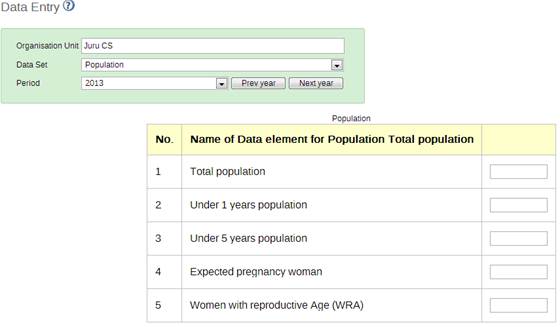
If you don’t have all of the data and you want users to enter the populations, create a dataset called population with a periodicity of Yearly and assign it to all health facilities. You can even create some indicators for each of your main target groups that are used in your indicator populations (Children <1 year, Expected Pregnancies, Children <5 years, Women of reproductive age 15-49, etc…) and include them in the dataset so that people can see the estimated sub-populations like the example below. This is useful with the pivot tables, as you can extract data element totals along with desired sub-population when calculating coverage rates.
Each year, ask health facility staff to update their populations through the dataset, or insert new records using the projected growth rate (I did both: asked facilities to update them first, then incremented any missing values using previous year’s data.)
Good luck,
Randy
···
How to insert the populations health facility … as many of our indicators as the denominator population health facility
There are a couple of steps to this process depending upon the data you have available and the approach that you use for calculating the different denominators.
Decide whether you will only store total catchment population for each facility and then use national level percentages to calculate specific service target populations. For example in Rwanda we multiply total population by 4.1% to estimate the expected pregnancies and 23.6% to estimate the women of reproductive age, etc… If this approach works for you then you only need to create a single data element “Population” and the rest of the target populations can be calculated as indicators. You can also use the ‘Constants’ feature in data administration to define these percentages so that you can change them easily.
Normally the facility target populations don’t add up to 100% of the national population, so you will probably want to add official census projected populations at the lowest level that they are available. Note for your data element you should define 2 aggregation levels for Population. In our case they are Facility and Sector. All of the higher levels are automatically aggregated.
If you have the estimated target populations for each facility in a spreadsheet, you can import them into the datavalue table (normally you import one record per year per facility so make sure you get the periodid, dataelementid, and sourceid=organisationunitid fields correct) before appending them.
If you don’t have all of the data and you want users to enter the populations, create a dataset called population with a periodicity of Yearly and assign it to all health facilities. You can even create some indicators for each of your main target groups that are used in your indicator populations (Children <1 year, Expected Pregnancies, Children <5 years, Women of reproductive age 15-49, etc…) and include them in the dataset so that people can see the estimated sub-populations like the example below. This is useful with the pivot tables, as you can extract data element totals along with desired sub-population when calculating coverage rates.
Each year, ask health facility staff to update their populations through the dataset, or insert new records using the projected growth rate (I did both: asked facilities to update them first, then incremented any missing values using previous year’s data.)
Thanks Randy for the very useful and informative write-up.
An addition to 5.: It might be useful to set the “expiry days” property on that population data set in order to lock it after a reasonable time. This in order to prevent users from changing the population data after it has been reviewed. We have seen that it becomes tempting for users to reduce their population in order to achieve better indicator coverage scores
Also, to validate that manually entered population data is reasonable, you might create a line chart in data visualizer where you put e.g. all districts as series, last 5 years as categories and the total population data element as a filter (you should see slowly ascending, relatively straight lines).
Very useful. I also might share the other notes I sent to Riddy about how to set up the population data element and coverage indicator aggregation types depending upon the type of indicator. Please check my logic, of course! The notes are below:
“The indicators denominators are automatically adjusted according to the time period used in the analysis. If your analysis is by quarter the population is divided by 4, if it is by month it is divided by 12, etc….
If you look on the indicator definition screen there is an option to annualize the indicator. If you say ‘Yes” that means that the denominator will be divided by the number of periods you are using for the analysis. For example if you have an indicator like deliveries, you want the denominator annualized because each month you expect 1/12 of the pregnant women to deliver. If you have a cumulative data element like Family Planning users at the end of the month, then you don’t want to annualize, because you expect all women of reproductive age to be using the method every month.
For cumulative data elements (FP users at end of month, patients on ARV, etc…) also make sure to set the aggregation method in the data element definition screen to ‘Average’, otherwise it will add up the cumulative data in the numerator giving you a big error if you do annual or quarterly analysis. Normally those indicators are calculated using the data from the most recent month only, but an average is ok if you are looking at a period longer than a month.”
···
Thanks Randy for the very useful and informative write-up.
An addition to 5.: It might be useful to set the “expiry days” property on that population data set in order to lock it after a reasonable time. This in order to prevent users from changing the population data after it has been reviewed. We have seen that it becomes tempting for users to reduce their population in order to achieve better indicator coverage scores
Also, to validate that manually entered population data is reasonable, you might create a line chart in data visualizer where you put e.g. all districts as series, last 5 years as categories and the total population data element as a filter (you should see slowly ascending, relatively straight lines).