how to create a population pyramid chart with dhis2?
Dear @Dan_Djari_Harouna
Thank you for your post and patience! Would you like to share why is this chart in particular important? Have you checked out the other chart types available in the Data Visualizer app? Could they work? If not, please explain!
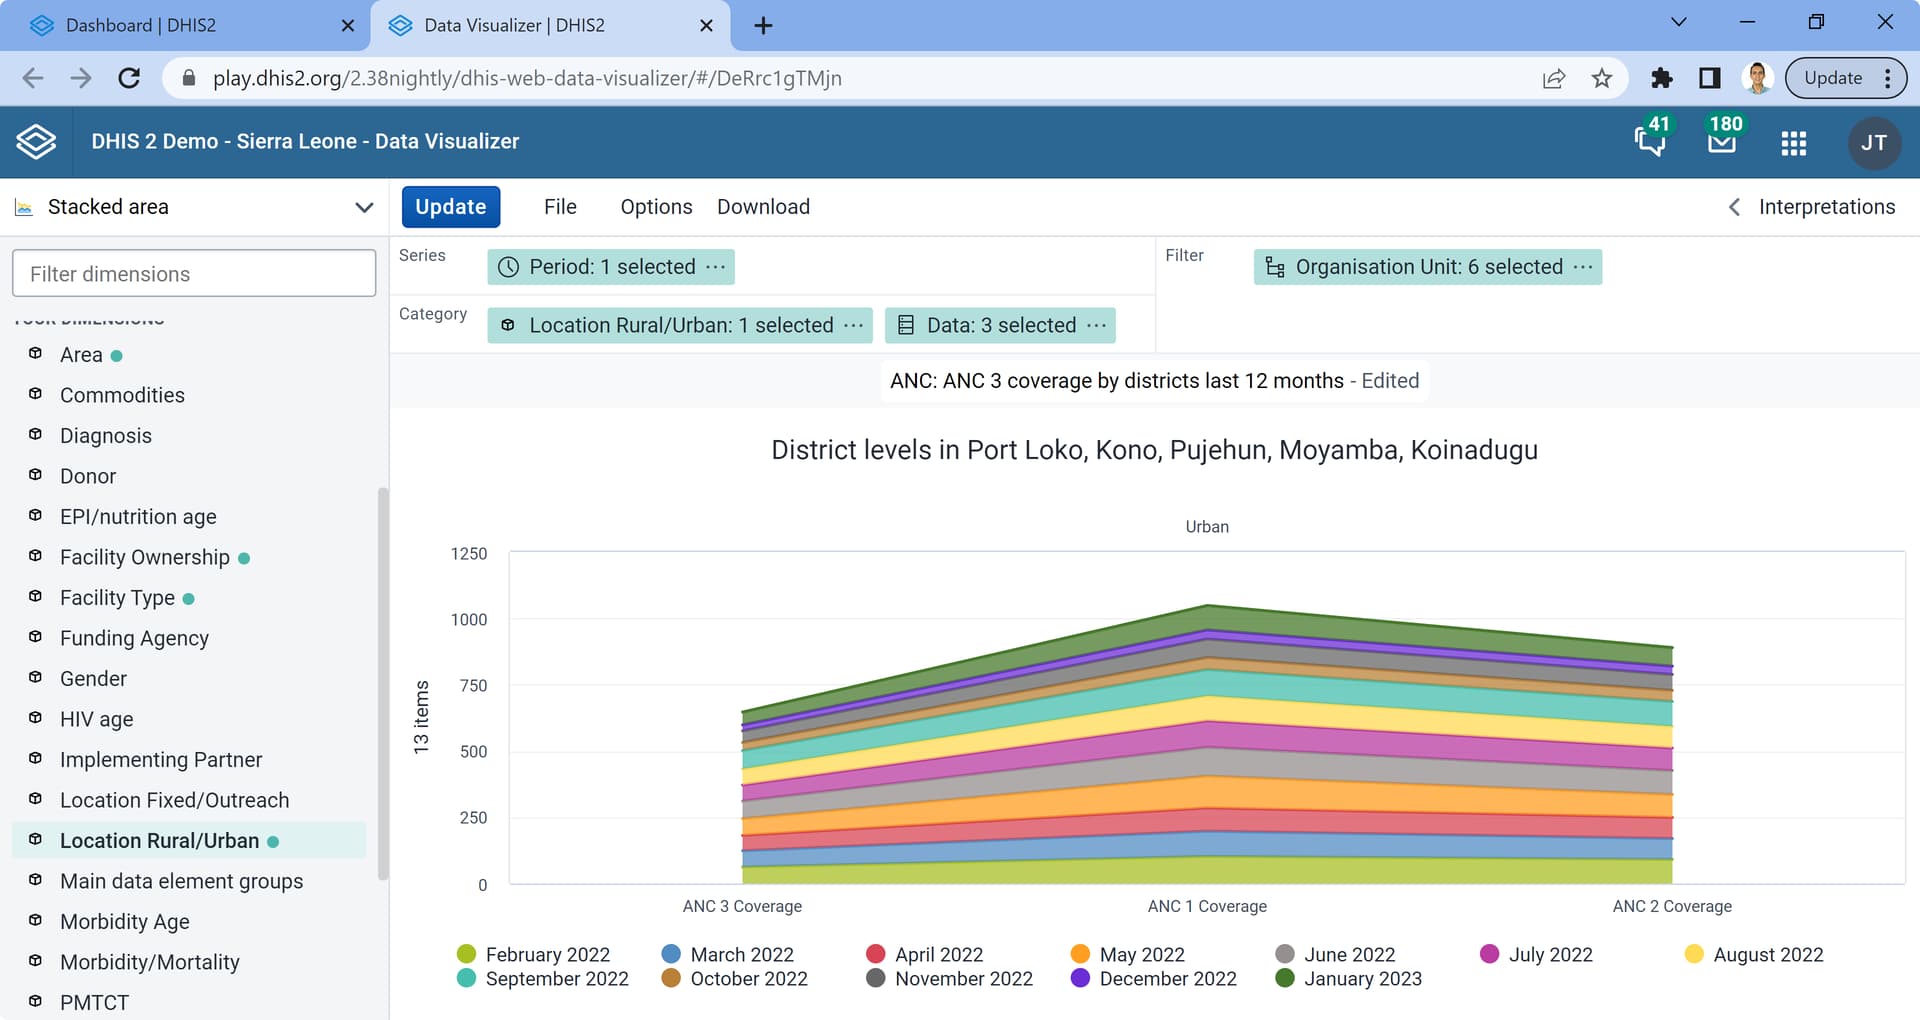
Maybe a Stacked Area chart such as this one:
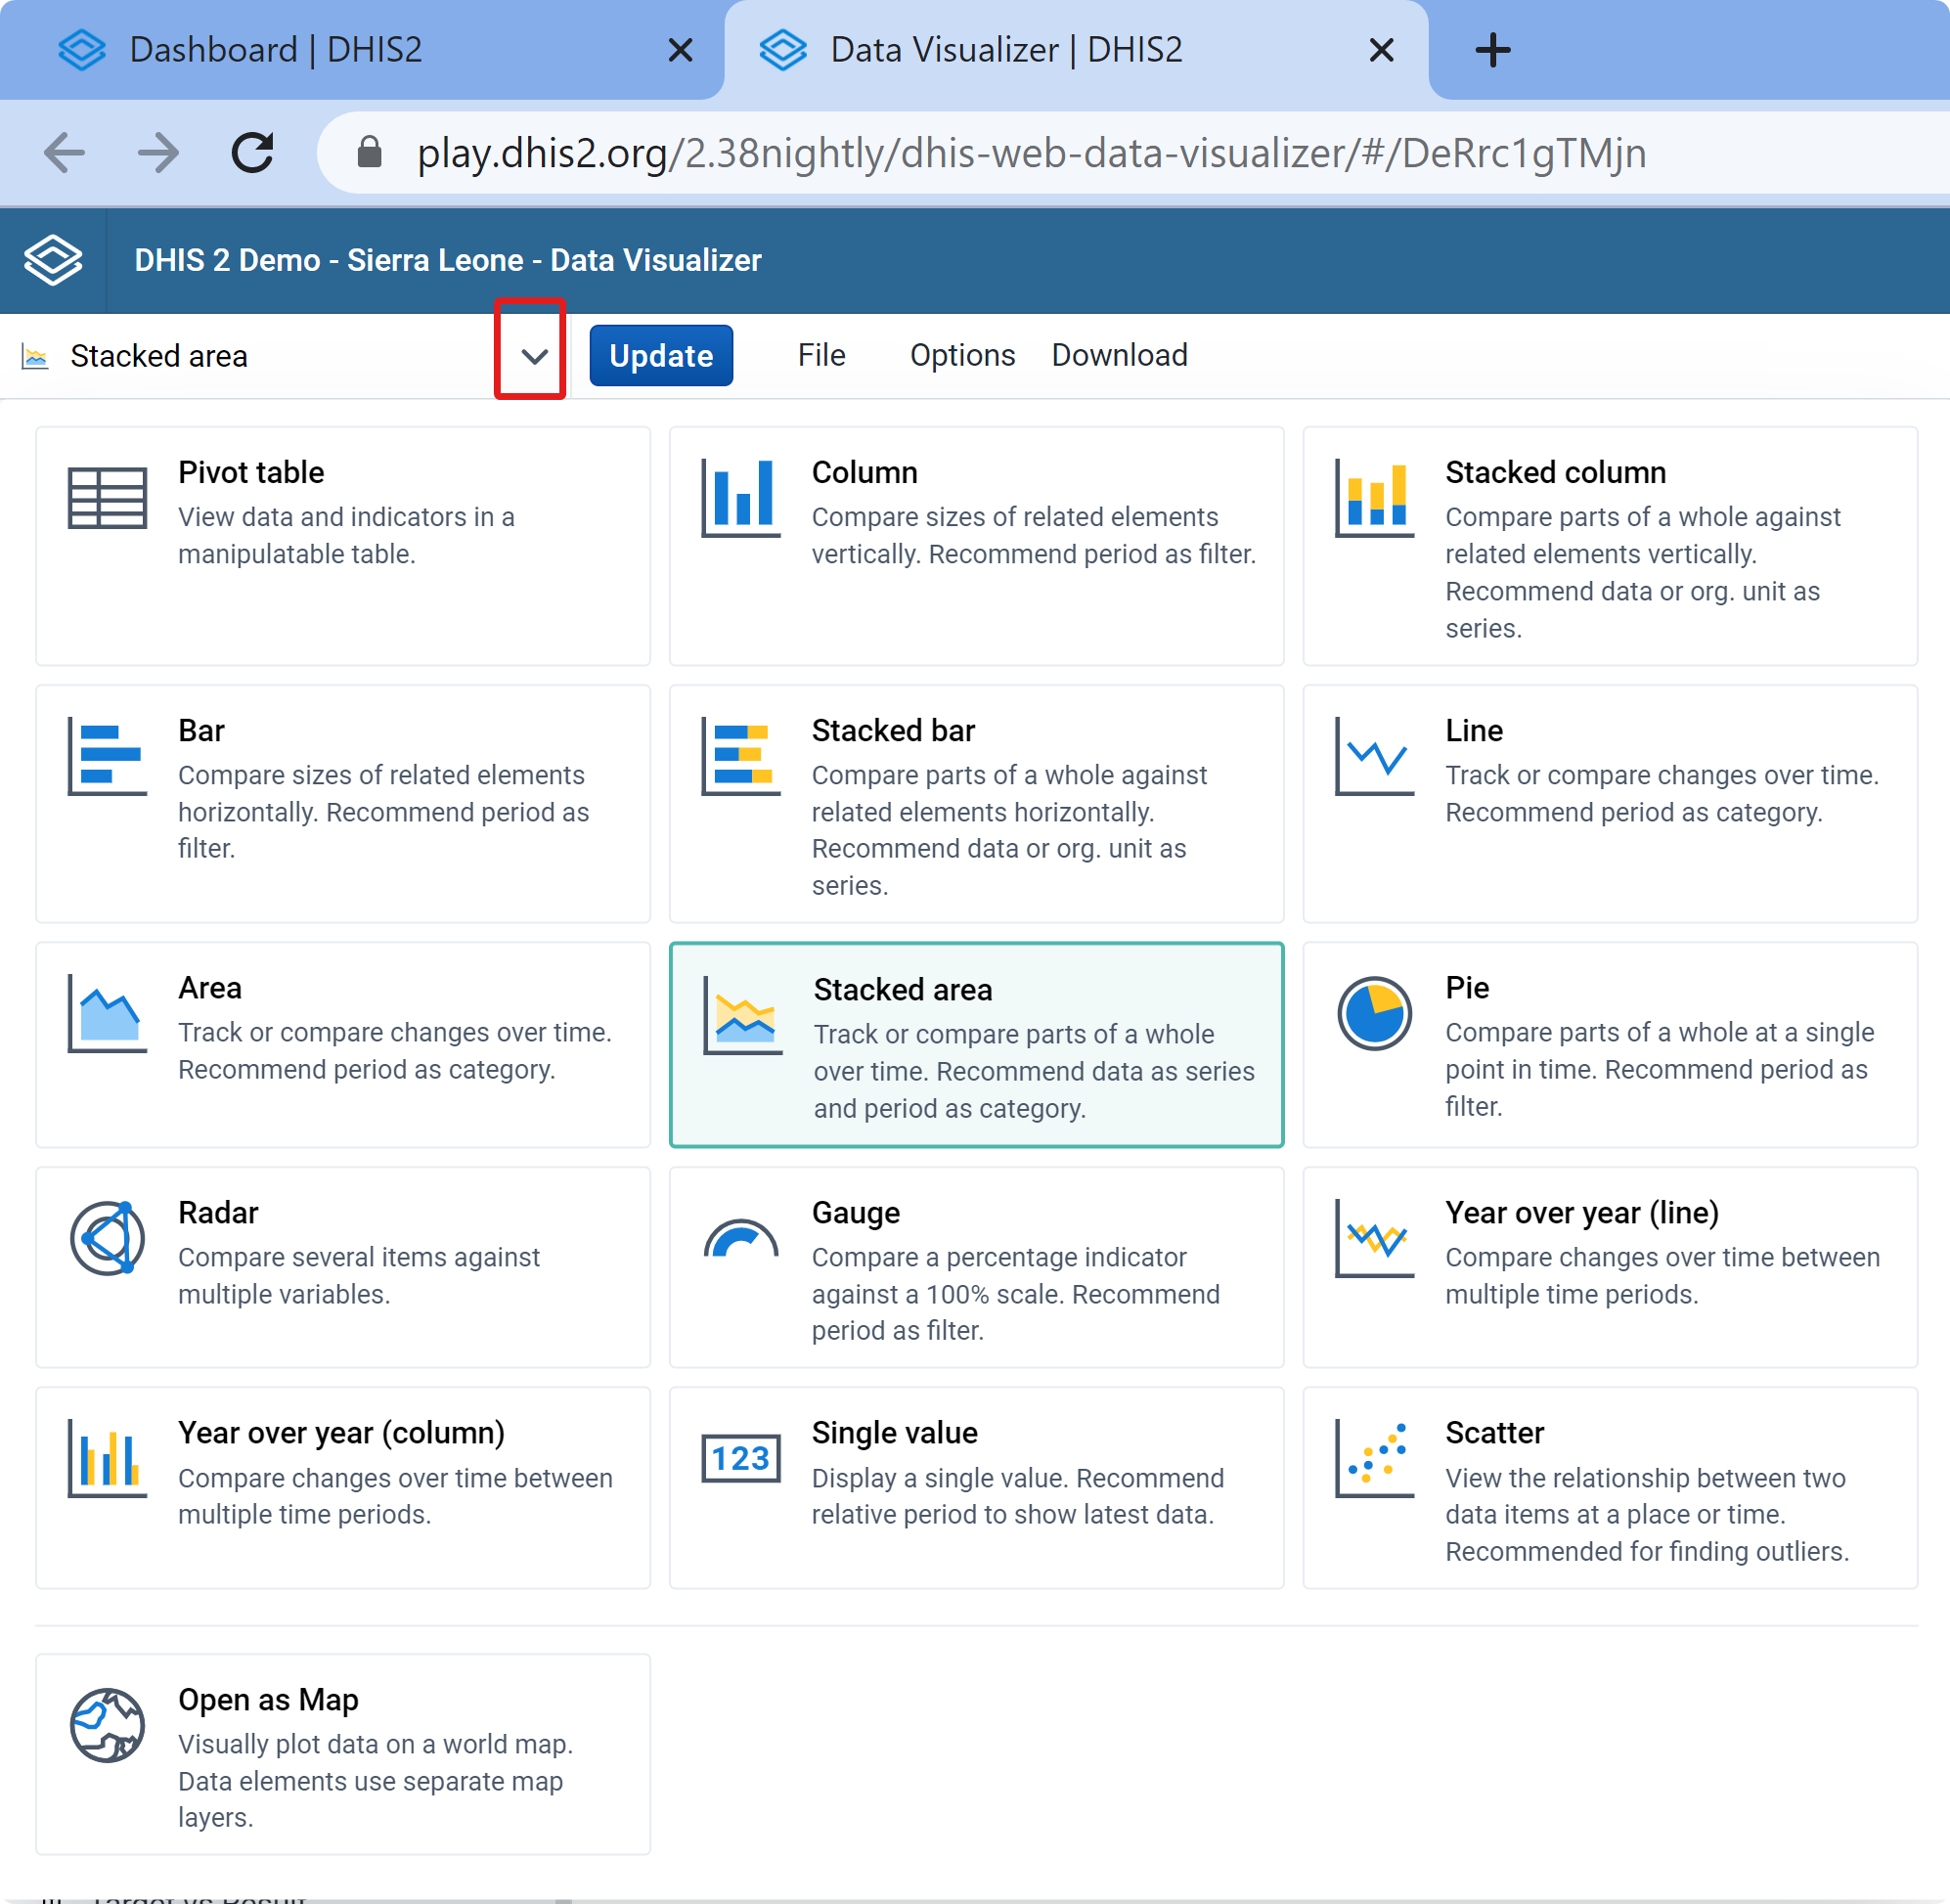
To check out all the available charts, please click on the downward facing arrow to the right of the Update button in the Data Visualizer app:
Thank you!
@Gassim Thank you very much for the contribution and I apologize for my late reply. Indeed, our team would help compare the evolution of the population according to age groups. Not all graphic options suit us, the pyramid is more suitable. We proceeded as follows:
- creation of pyramids in Microsoft Excel
- Import under dhis2 as a resource
THANKS