Hi Members
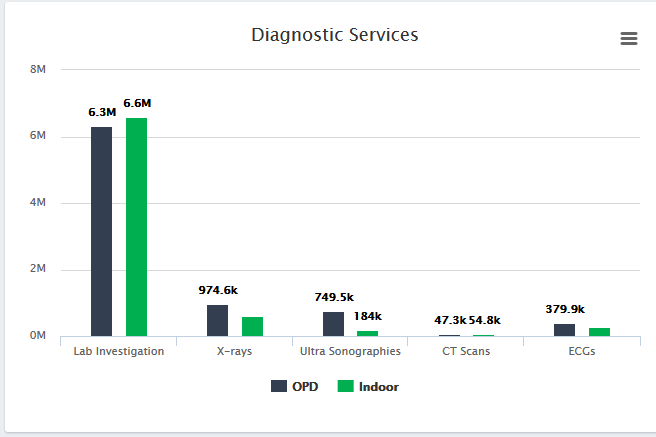
I would like to develop graph of OPD and IPD with series Xray, Lab Investigation and CT Scan
A series of Lab Investigation should show data with break up IPD and OPD
Please help me to develop such graph
Regards
Javed Akram
Hi Members
I would like to develop graph of OPD and IPD with series Xray, Lab Investigation and CT Scan
A series of Lab Investigation should show data with break up IPD and OPD
Please help me to develop such graph
Regards
Javed Akram
Hi @mrjavedakram,
Assuming both OPD and IPD are datasets, if you want to do comparison, I would suggest that you create catCombos with Data Dimension Type Dissaggregate (Will show in Analytic as a Dimension for Display). Or you use grouping.
Otherwise, please provide more details on your data collection tools.
#StaySafe
Emma