I don’t know what is going but all the graph in the dashboard end up in error

and most icons are no more showing… (you can click on the menu, but icon stays hidden)

ex the menu of apps are not showing up.
the technical details
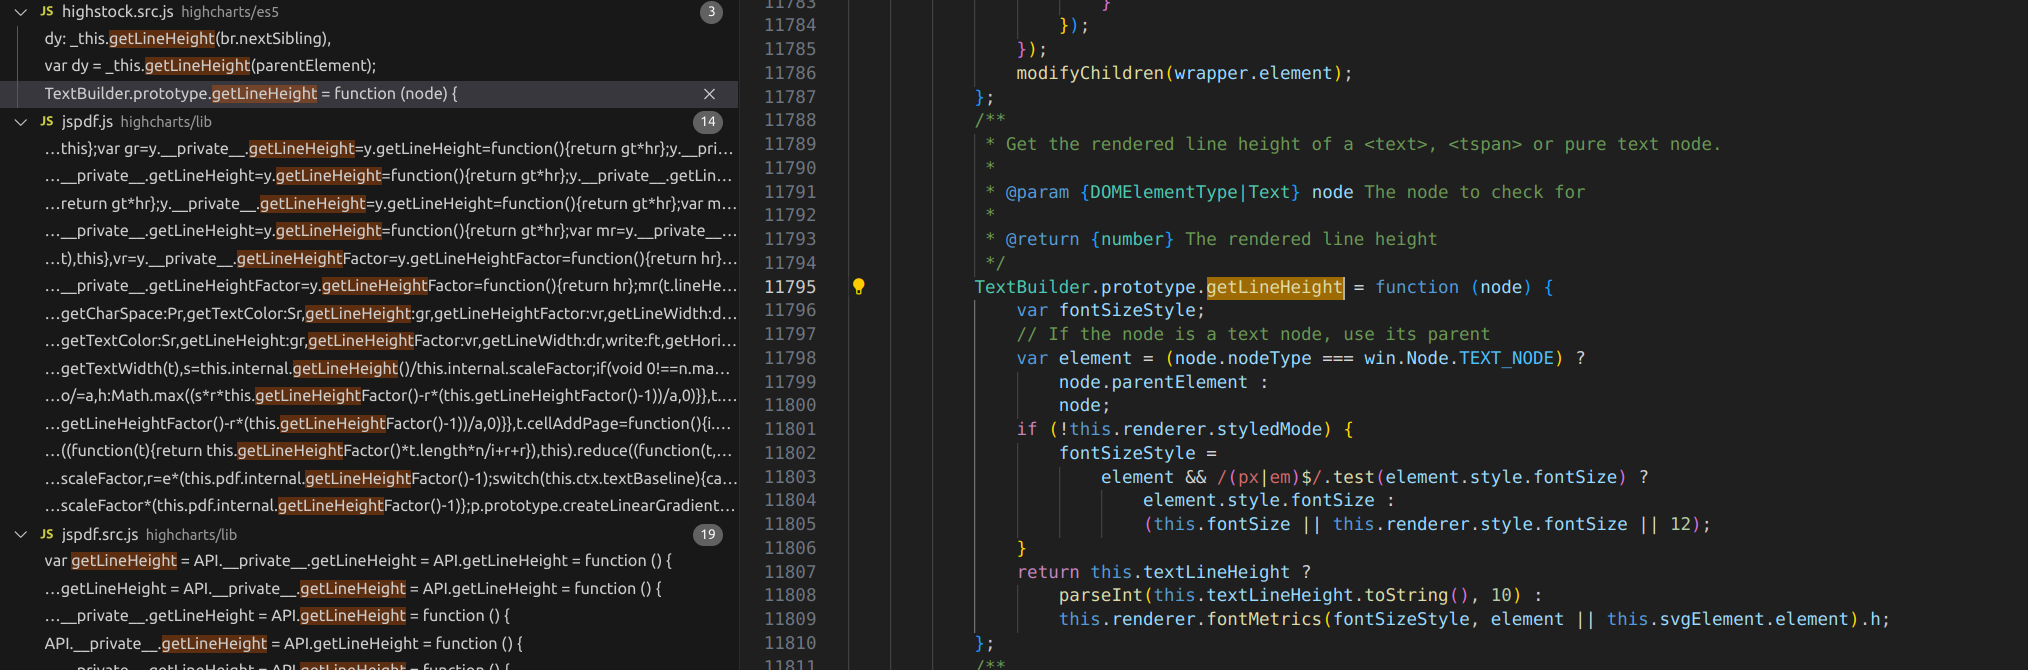
TypeError: e.style is undefined
5046/n/</t.prototype.getLineHeight@/dhis-web-data-visualizer/static/js/plugin-8961.4097e496.chunk.js:2:1043831
d@/dhis-web-data-visualizer/static/js/plugin-8961.4097e496.chunk.js:2:1042781
5046/n/</t.prototype.modifyDOM/c/<@/dhis-web-data-visualizer/static/js/plugin-8961.4097e496.chunk.js:2:1043580
c@/dhis-web-data-visualizer/static/js/plugin-8961.4097e496.chunk.js:2:1043529
5046/n/</t.prototype.modifyDOM@/dhis-web-data-visualizer/static/js/plugin-8961.4097e496.chunk.js:2:1043668
5046/n/</t.prototype.buildSVG@/dhis-web-data-visualizer/static/js/plugin-8961.4097e496.chunk.js:2:1041833
5046/n/</i.prototype.buildText@/dhis-web-data-visualizer/static/js/plugin-8961.4097e496.chunk.js:2:1048981
5046/n/</e.prototype.css@/dhis-web-data-visualizer/static/js/plugin-8961.4097e496.chunk.js:2:1023203
5046/n/</e.prototype.layOutTitles/<@/dhis-web-data-visualizer/static/js/plugin-8961.4097e496.chunk.js:2:1173947
5046/n/</e.prototype.layOutTitles@/dhis-web-data-visualizer/static/js/plugin-8961.4097e496.chunk.js:2:1173741
5046/n/</e.prototype.setTitle@/dhis-web-data-visualizer/static/js/plugin-8961.4097e496.chunk.js:2:1173091
5046/n/</e.prototype.render@/dhis-web-data-visualizer/static/js/plugin-8961.4097e496.chunk.js:2:1182768
5046/n/</e.prototype.firstRender@/dhis-web-data-visualizer/static/js/plugin-8961.4097e496.chunk.js:2:1185052
5046/n/</e.prototype.init/<@/dhis-web-data-visualizer/static/js/plugin-8961.4097e496.chunk.js:2:1169217
v@/dhis-web-data-visualizer/static/js/plugin-8961.4097e496.chunk.js:2:990458
5046/n/</e.prototype.init@/dhis-web-data-visualizer/static/js/plugin-8961.4097e496.chunk.js:2:1168240
5046/n/</e.prototype.getArgs@/dhis-web-data-visualizer/static/js/plugin-8961.4097e496.chunk.js:2:1168173
e@/dhis-web-data-visualizer/static/js/plugin-8961.4097e496.chunk.js:2:1168015
highcharts@/dhis-web-data-visualizer/static/js/plugin-8961.4097e496.chunk.js:2:775564
4970/gl/this.createVisualization@/dhis-web-data-visualizer/static/js/plugin-8961.4097e496.chunk.js:2:776619
Rl@/dhis-web-data-visualizer/static/js/plugin-8961.4097e496.chunk.js:2:781544
7833/Ke/v<@/dhis-web-data-visualizer/static/js/plugin-app.792e000c.chunk.js:1:24458
7833/Ke/<@/dhis-web-data-visualizer/static/js/plugin-app.792e000c.chunk.js:1:24738
ls@/dhis-web-data-visualizer/static/js/plugin-372.e3d447b8.js:2:413199
Sl@/dhis-web-data-visualizer/static/js/plugin-372.e3d447b8.js:2:432013
2537/t.unstable_runWithPriority@/dhis-web-data-visualizer/static/js/plugin-372.e3d447b8.js:2:505000
Bi@/dhis-web-data-visualizer/static/js/plugin-372.e3d447b8.js:2:375082
_l@/dhis-web-data-visualizer/static/js/plugin-372.e3d447b8.js:2:431772
sl@/dhis-web-data-visualizer/static/js/plugin-372.e3d447b8.js:2:423548
8894/Ki/<@/dhis-web-data-visualizer/static/js/plugin-372.e3d447b8.js:2:375373
2537/t.unstable_runWithPriority@/dhis-web-data-visualizer/static/js/plugin-372.e3d447b8.js:2:505000
Bi@/dhis-web-data-visualizer/static/js/plugin-372.e3d447b8.js:2:375082
Ki@/dhis-web-data-visualizer/static/js/plugin-372.e3d447b8.js:2:375320
$i@/dhis-web-data-visualizer/static/js/plugin-372.e3d447b8.js:2:375253
Sl@/dhis-web-data-visualizer/static/js/plugin-372.e3d447b8.js:2:432120
2537/t.unstable_runWithPriority@/dhis-web-data-visualizer/static/js/plugin-372.e3d447b8.js:2:505000
Bi@/dhis-web-data-visualizer/static/js/plugin-372.e3d447b8.js:2:375082
_l@/dhis-web-data-visualizer/static/js/plugin-372.e3d447b8.js:2:431772
8894/kl/<@/dhis-web-data-visualizer/static/js/plugin-372.e3d447b8.js:2:431683
z@/dhis-web-data-visualizer/static/js/plugin-372.e3d447b8.js:2:503940
2537/k.port1.onmessage@/dhis-web-data-visualizer/static/js/plugin-372.e3d447b8.js:2:502696

    in Ke
    in div
    in div
    in Lt
    in At
    in ot
    in Ft
    in div
    in Bt
    in Suspense
    in Nr
    in div
    in div
    in Rr
    in Je
    in Se
    in Re
    in Ze
    in je
    in Xe
    in d
    in te
    in pe
    in X
    in DHIS2RuntimeProvider
    in Fr
    in Mr
    in hr
    in Nr
    in Hr
    in _
version details
{
  "app_name": "Dashboard",
  "app_version": "100.0.3",
  "dhis2_version": "2.40.3.2",
  "dhis2_revision": "3fcd748"
}