We have aggregate data that we are uploading through the API, as well as creating indicators and a few other resources. Now we are trying to automate the creation of simple charts and tables as well.
I see though the docs that:
There are plugins for creating charts and tables within an external web page
You can “view analytical resource representations” that have already been created
You can create dashboards and add items to them
Is there a way to auto-generate charts and tables within DHIS2 using the API? Or do they have to be created manually through the user interface?
@Vladimer_Shioshvili thank you for the reply. I understand that you can retrieve the data along the desired dimensions using the analytics endpoint, but is there a way to push that back into DHIS2 as a chart or table? or do I have to manually create that chart using the apps in DHIS2?
Ah, I see. I don’t think that part is documented. If you can construct the object, you can POST to the api/reportTables endpoint. I personally don’t have experience with that. Hopefully others can help. You would have to construct something like this and POST is (I think): https://play.dhis2.org/2.33.1/api/reportTables/qfMh2IjOxvw
Hi @Parker,
If you do not mind to share, why you want to to create chart and table through API is there any specific use case for it? If you push your reporting data continuously through API and create chart and table manually in DHIS2 these are going to be updated as per usage time dimension, filtering criteria and reporting indicators used for building that particular chart and table. Assume visual and analytics indicators would be finite for a project or organization if this is not you may review your requirement analysis steps.
@sohel,
We are trying to figure out the best use cases for pushing our health data to a DHIS2 instance (whether to do it in aggregate form or by event, how much data from our events to include, etc.) and so we are doing a lot of iterations of uploads to a DHIS2 instance. It would be more efficient if we could automate not only the database side of the upload, but also the front end tables and charts seeing as we know exactly what we need to construct them.
Through the API you can create dashboards and add content to them, so it seems as though the only gap in being able to fully automate a DHIS2 instance is the inability to POST an analytical resource representation.
Meanwhile, the ability to embed these resources in an external website or portal using the plugins is almost exactly the functionality that is missing.
Hi @Parker,
I understand your need as POST new reportTables through the API. Ive had to do a similar process by trial and error. Something like @Vladimer_Shioshvili 's approach will work.
Create and save a template pivot table representation in pivot tables app and find the UID in the URL.
Find the metadata for your template. I suggest querying this endpoint, with the template UID last: https://play.dhis2.org/2.33.1/api/metadata.json?filter=id:eq:qfMh2IjOxvw
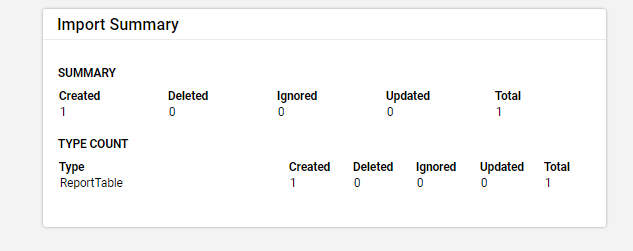
Unlike the api/reportTables resource, this representation will identify the JSON array as reportTable objects, making it easier to re-import through metadata import app later.
Once you save this JSON payload, you can manipulate the template programmatically, e.g. plugging in different data element IDs or periods, and then POST back to api/metadata. To test it out manually, open the JSON file in an editor, delete the old UID key-value pair, edit the old name attribute, then save and re-import through import/export app.
Hope this helps!
@brian Thank you very much for your input, this is extremely helpful. I will let you know when I test this out but it looks like this should save some time. I also found that the /api/dashboards/<id>/metadata.json link is very helpful for saving full representations of dashboards in a way that the metadata export within the app cannot. Thanks again for all the help!