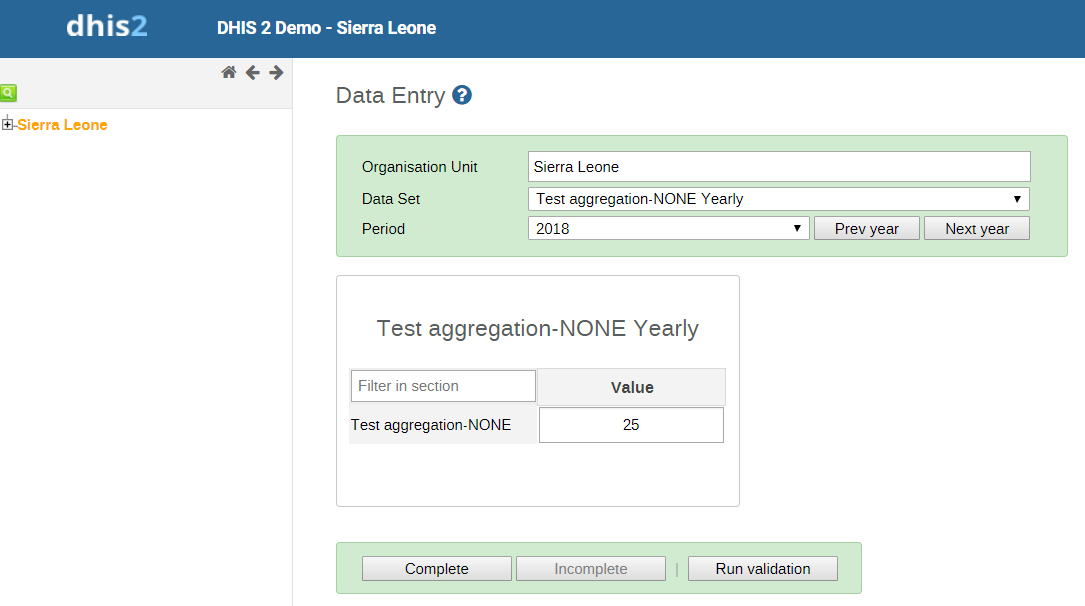
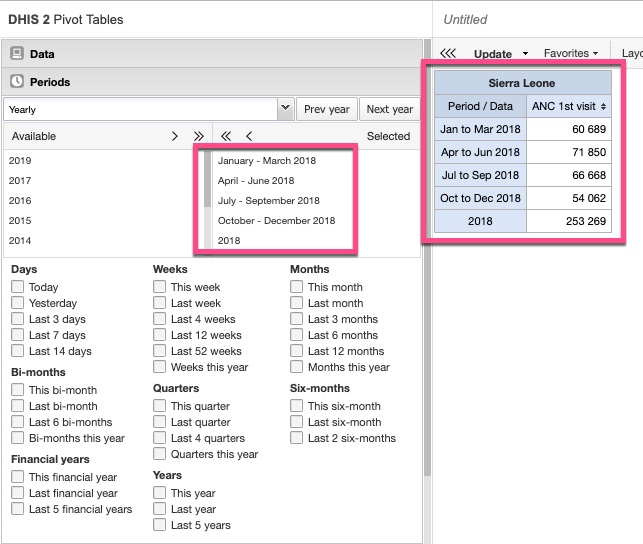
I am having a problem with NONE aggregation for Number type data elements (DHIS 2 version 2.30). I was hoping that I’d be able to use this as a workaround to a data element that does not aggregate according to any of the built-in rules. I am importing quarterly data, and then also importing annual data for the same data element according to aggregation done outside of the instance. My expectation was that analytics would show my annual figure in pivot tables given the annual period dimension, and the quarterly figures for each quarterly period dimension. Instead, the annual dimension reports one of the four quarters (I’m not sure how it chooses which). I’m attaching screenshots from a test I did on https://play.dhis2.org/2.30:
My inclination is to raise a ticket in JIRA, but I’m not sure if this deviates from the expected behavior, so I’m not sure whether this is a bug report or a feature request. The official documentation described NONE as “No aggregation is performed in any dimension.”
1 Like
Hi Sean,
Thanks for posting this issue, very interesting. I’m not sure how DHIS2 is giving you the annual figure that you’re getting - since you haven’t specified an aggregation, it’s quite possibly randomly supplied by the underlying Postgres database (if an order or aggregation isn’t specified, databases will return records in a random order, which can change every time additional values are inserted into the database table). But since all your data is stored in a single data element, regardless of whether or not it’s aggregated, your annual figure will always draw on both annual and quarterly data values. (In pivot tables, DHIS2 org units and periods work in a hierarchy - so analysis at district level will always draw on both a district and its child clinics etc, and analysis at annual level will always draw on both annual and quarterly/monthly figures.)
From a design perspective, I think an underlying factor is that you’re capturing two different data collections (quarterly data and externally-supplied annual data) into a single data element. This is a subjective design call, so it would be good to hear other experts’ perspectives on this too, but if you’re capturing two different versions of the same data, it sounds to me like you’d be much better served by having two versions of each of these data elements. You’d be able to much more clearly segregate them, you’d still be able to easily put them side-by-side into a single pivot table, and it would open up a lot of other possibilities (eg using the built-in aggregations, which could be useful for your quarterly figures).
I realise that I don’t have the full picture, and that there might be other business requirements or design considerations that have led you down this path, so I do understand if you’re tied to using a single data element for both data collections. But if not, then I would definitely consider splitting this out, as being able to use built-in aggregations could resolve the issue you’ve encountered above.
Cheers, Sam.
1 Like
Thank you Sam,
Your point is well-taken. I find that getting users to shift over to using a DHIS-2 based dashboard who are used to less efficient, but more customizable options (i.e., Excel) is difficult if I can’t start with whatever they’re used to. In this case, it is a disadvantage (and potentially confusing) not to be able to put multiple quarters and the year on the same line of the pivot table when the table has a moderate to large number of indicators. I can work around this by having quarterly and annual data as separate attributes, which is fine for a dashboard but creates a risk of double-counting if users manipulate the analytics themselves.
I am bit more concerned that something erroneous seems to appear with the NONE aggregation, as I definitely have use cases where I would not want the quarterly data to move up the period hierarchy; as soon as I have time I’ll run another test to make sure this doesn’t appear if I don’t input an annual figure.
1 Like
Hi Sean,
Just to clarify, I unfortunately don’t think you can stop the DHIS2 analytics from compiling all values within a period (eg all annual, quarterly and monthly values will be compiled when you select a given year). The ‘aggregation type’ just tells DHIS2 how to process these values after they have been compiled - eg sum them, average them, etc.
You can actually mix quarterly and annual data for a single indicator side-by-side in a pivot table or chart. (You don’t need to have that data captured twice in the system.) Add the data element or indicator you want, then use the ‘select period type’ drop-down to select ‘quarterly’ and then the four quarters you want, followed by ‘yearly’ and the year you want - in your pivot table, you’ll see the four quarters followed by the annual total. (Is that what you were after?)
Note that you can do the same thing with tick-boxes (tick both quarterly and yearly figures), but DHIS2 unfortunately doesn’t currently have a ‘quarters in previous year’ option.
Cheers, Sam.
1 Like