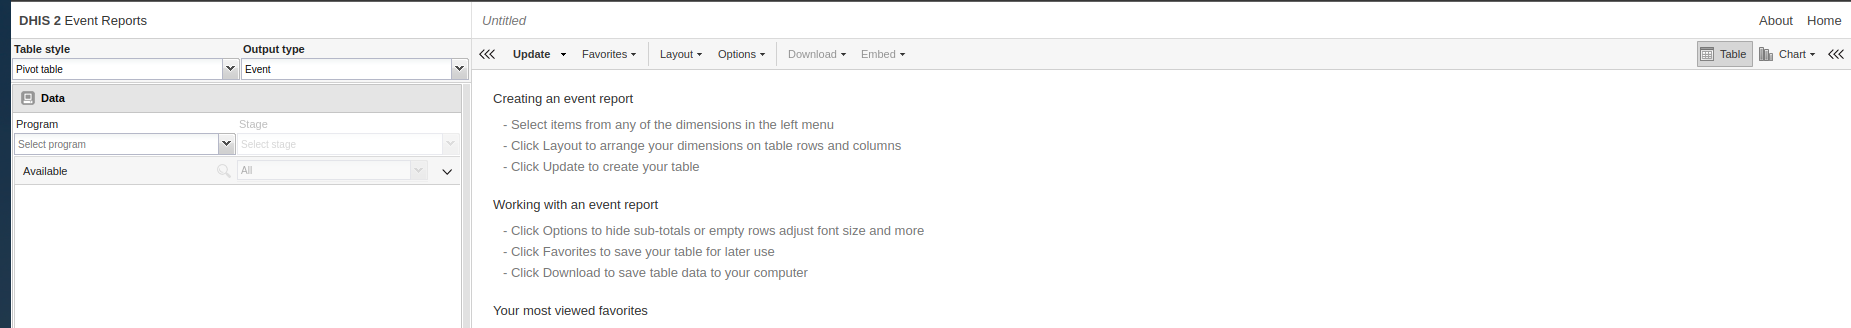
In the context of data reporting, with the app event report, we wanted to select Aggregated event reports Pivot table-style analysis with aggregated numbers, but unfortunately, the app doesnt allow me to select the Aggregated values, the option is hidden.
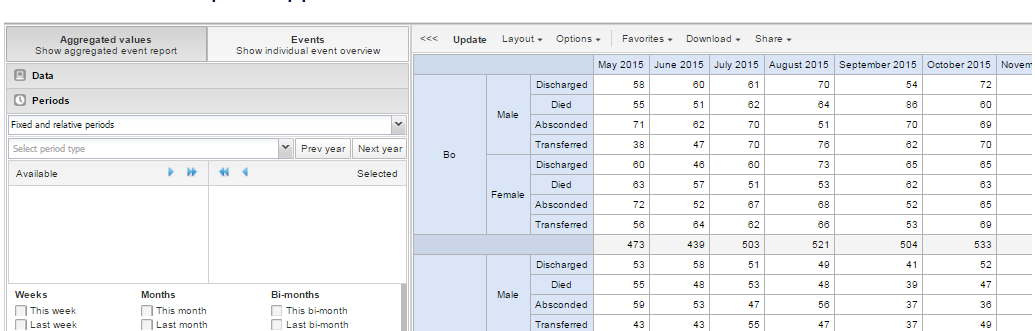
Thanks for your question! If I understand your question properly, if you select the table style as a pivot table then it will show aggregated results whereas if you select the table style as line list then it’ll list the events at the individual level.
One question please where did you take the second screenshot from? Which dhis2 version? Also have you tried the new line listing app?
Hi @Gassim
Thanks for your support and availability.
We are trying to visualizer the Aggregated data set, but the option or field to select the Aggregated values is hidden (unavailable), and the report we trying to get is not from a tracker program is from Data set forms.
Your question One question please where did you take the second screenshot from? Which dhis2 version? Also have you tried the new line listing app?
Please have tried to use the Data Visualizer app for these aggregated datasets? The Event Reports app is only for the tracker/event programs.
This screenshot is from an older version so that’s why it appears different; however, the Event Reports app has always been for tracker/event programs.