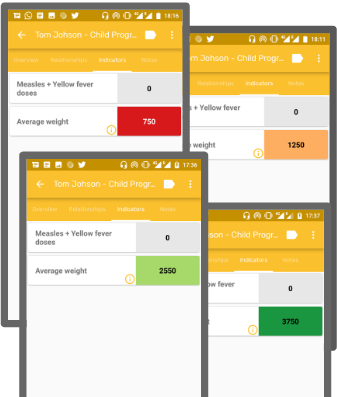
We are calculating percentages through program indicators, and we would like to display different colours on the dashboard on android tablets based on percentages, e.g.,
PI A >= 80 - Green
PI B >=50 - Yellow
PI < 50 - Red
It this possible to display legends (color) along with program indicators on android?
Indicators to be displayed in the App, can be calculated with the data from the Tracked Entity Instance (TEI) enrollment. Please keep in mind that calculations will apply in the domain of the TEI and the current Enrollment.
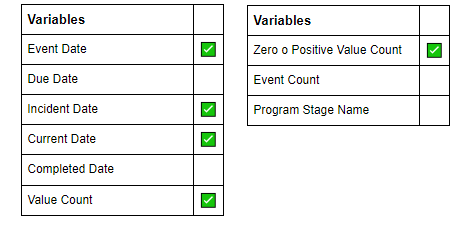
Aggregation types are not available, only Last Value can be used in the calculation of the indicator. All DE and constants can be used in the calculations. Variables are supported according to the following table:
You can check the updated information of what is supported when using program indicators in the configuration guide. Analytic period boundaries are not supported, neither planned for future support, as they apply to multiple TEI’s.
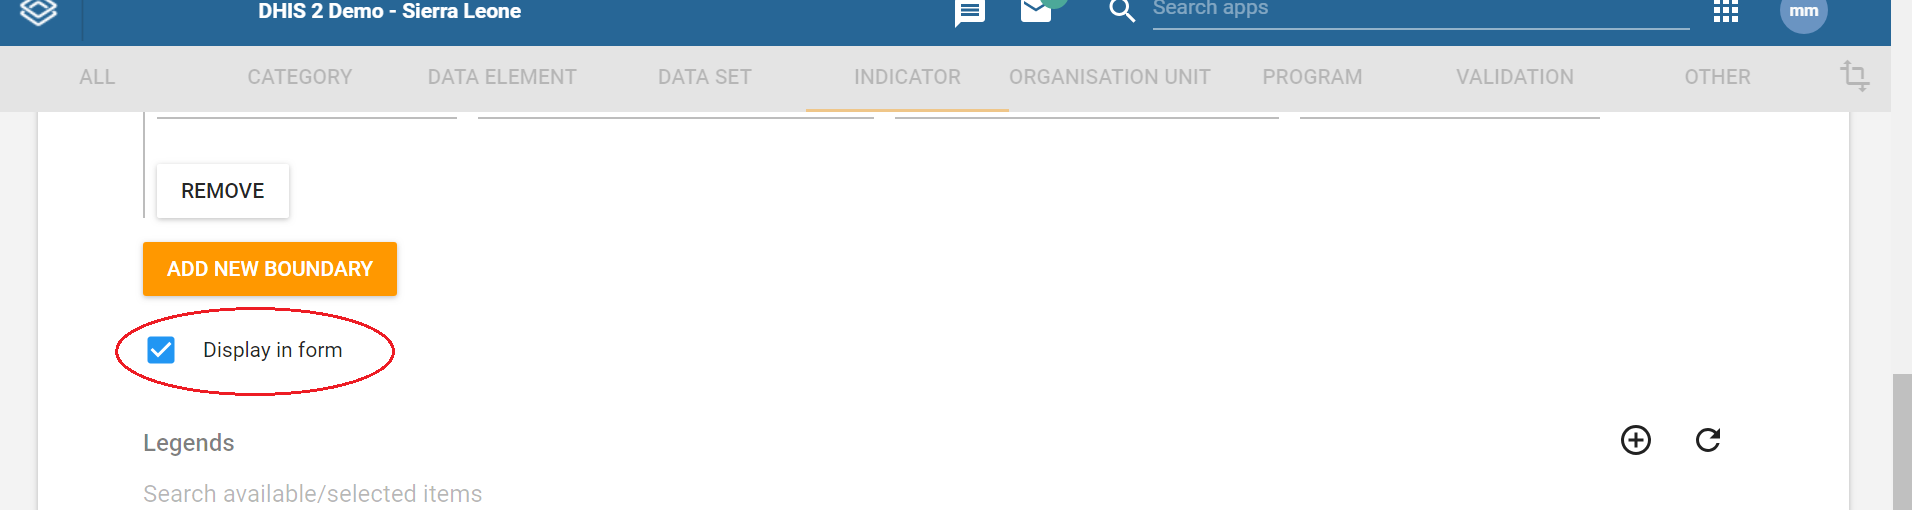
In order to display a program indicator in the App, you must select the checkbox “Display in form” in the DHIS 2 server indicator configuration wizard.
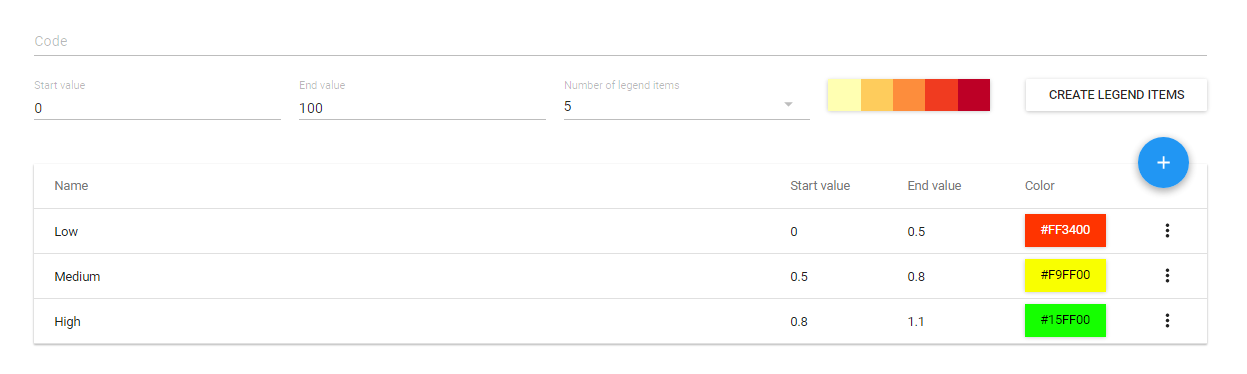
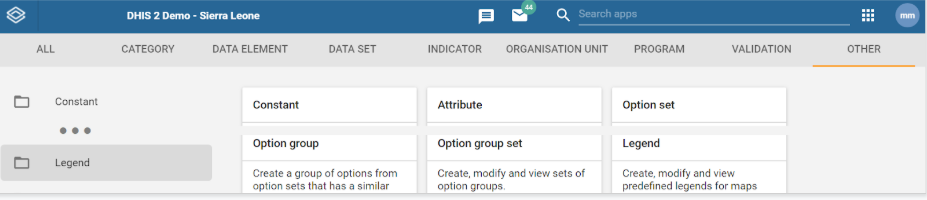
Once you have designed your indicator, you can assign a legend to it. In your DHIS 2 Server go to Maintenance > Others > Legends to create an new legend.
Once you have created the legend you can assign it to the indicator. Alternatively, you can assign an already existing legend. Right underneath the checkbox to display the indicator in the App, you will find the section to search and assign the legend.
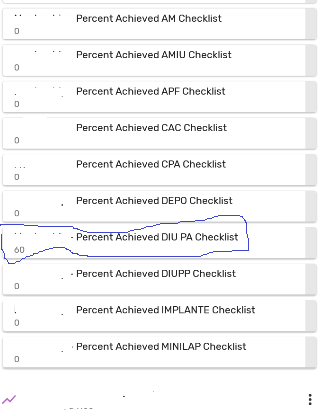
I have assigned a legend to program indicators to display different colors depending on the result, but it does not show any color. See here, the percentage is 60, so I hoped to see the yellow color.
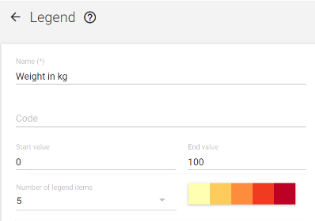
It’s not clear why you’re using decimals in the start and end values. Would you please try to replace:
start value: 0 end value: 50
start value: 50 end value: 80
start value: 80 end value: 100
 { .center }