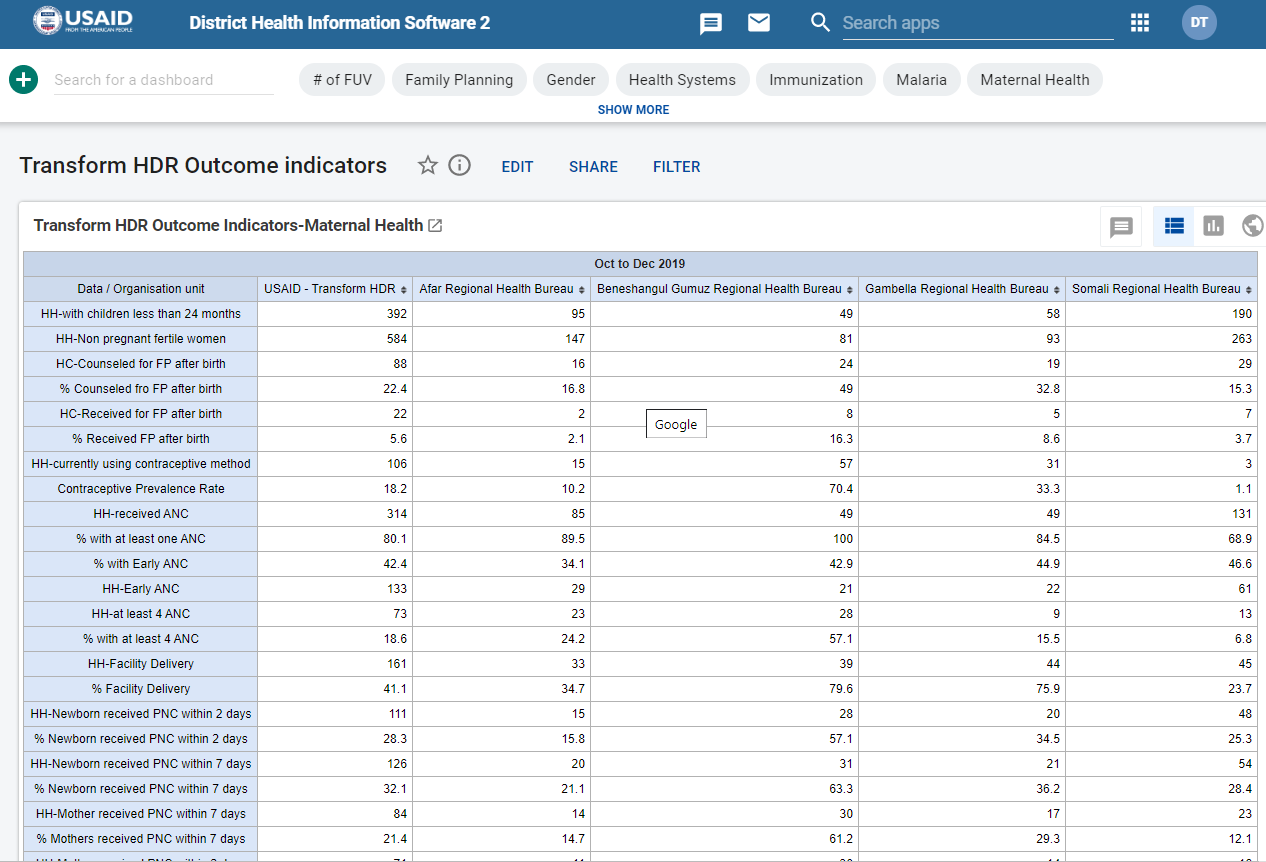
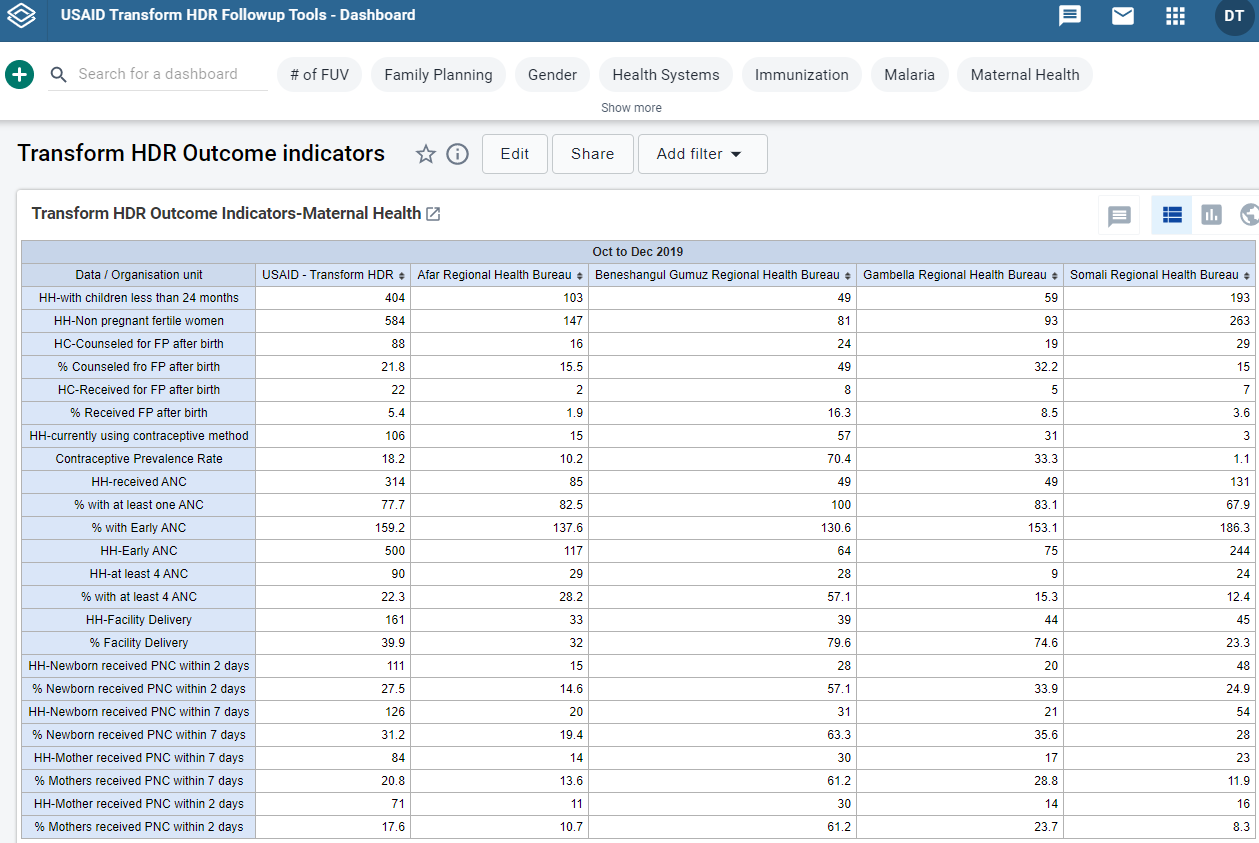
Hello, I am testing 2.33 to upgrade from 2.30. when I compare pivot table results on the exiting and new version, I see differences in some of the indicators. I tried to clear cache and look again with no avail. Any suggestion why this is happening? @seidhus
Hi Derebe,
It’s difficult to know what’s happening without a closer look at the instances. It looks like the absolute numbers in the 2.33 version are never lower than the 2.30 version, so a couple of quick things to check if you haven’t already done so:
-
Have the analytics been run at the same point on both instances (eg did you perhaps re-run the analytics after upgrade to 2.33, but not back on the original instance)?
-
Are you using a Data Approvals process? (Data Approvals were suddenly dropped in 2.33, so I’m not sure what affect that might have on your pivot tables if you’ve chosen to show only approved data.)
Just out of interest, are items like “HH-Early ANC” (which shows a massive difference) indicators or data elements? If indicators, it might be worth also putting the raw data elements into the pivot table, to see whether/where they differ…
Cheers, Sam.