I want to connect DHIS2 Pivot table with excel through API but i not able to do so if anyone want help and explain to me step by step that would be much appreciated
Welcome to the community! ![]()
Would you like to explain more about the use case? Additionally, the API will provide the results in JSON or CSV for example, is that what you are expecting? How do you want to display the pivot table as an image or rows?
It would be very interesting and important to know more about the use case perhaps there are alternative, easier, and already being used approaches. However, I think if you need to use the API then perhaps you’re better of requesting the data and letting the excel generate the pivot table (but why not make use of it on the DHIS2 app/platform?)
Thanks!
Hello @Gassim L-Gassim Sharaf Addin
Thanks for welcoming!
as in DHIS2 we create pivot table (In Visualization module) and get downloaded in excel which is in rows and columns.
the same way i want to create connection between those pivot tables and excel sheets whenever i want the data with one refresh i should be able to update the data in excel without extract it again and again from DHIS2 if you could explain step by step how to create this connection that would be much helpful
regards,
Thanks for the clarification! ![]()
I don’t know but we could ask if it’s possible to use PAT in this scenario:
I’m able to get the request to download a pivot table in xls/csv format (for example https://play.dhis2.org/2.39.1.1/api/analytics.csv?dimension=dx%3AReUHfIn0pTQ&dimension=ou%3AO6uvpzGd5pu%3Bfdc6uOvgoji%3Blc3eMKXaEfw%3BjUb8gELQApl%3BPMa2VCrupOd%3BkJq2mPyFEHo%3BqhqAxPSTUXp%3BVth0fbpFcsO%3BjmIPBj66vD6%3BTEQlaapDQoK%3BbL4ooGhyHRQ%3BeIQbndfxQMb%3Bat6UHUQatSo&tableLayout=true&columns=dx&rows=ou&skipRounding=false&completedOnly=false&filter=pe%3ATHIS_YEAR
Is there something where a PAT could be used to make the this link accessible anywhere, for example adding at the end of it, (https://play.dhis2.org/2.39.1.1/api/analytics.csv?..?token=***********?
If it is then one simple option in Google Sheets for example is to use =IMPORTDATA() function. There are probably other options once an accessible link is available.
yes, it is accessible i have tried from power Query in excel you can do that but just clarify the link of the pivot table where i should get that link.
let me clear that in excel by using power query you can create that connection but when i create and extract the data in only extra meta data even i took the link from download section csv link so if you could tell me where i can get the link which is exactly for the pivot table data then i will do the rest by myself.
Hi!
Actually, @austin informed me that it’d not be a good idea if it were used like this because the PAT “as that is a reusable authentication token and putting it in the querystring could expose it to someone who shouldn’t have access.”
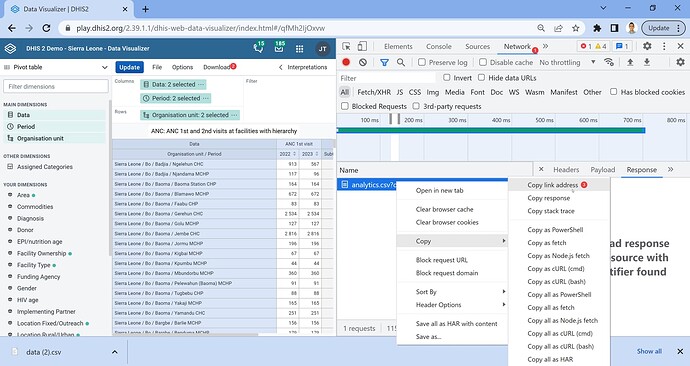
First, keep the Network tab in the DevTools open (F12 → Network) and then click on the download csv. After that you will see the link for the download appear in the Network log.
Thanks!
Hi,
Thank for the suggestion i have gone through and i was able to fetch the data into the excel but there was one concern regarding this solution. if you change the period in DHIS2 it doesn’t affect the excel sheet even though if you refresh the data. you have changed the entire link again go through same procedure again then you will have the updated data. so if you have any other solution for that let me know
thanks alot for your cooperation.
Right, this is why it’s better to create an API request rather than a download of the generated pivot table. ![]() I think this is the solution if it’s okay that the results are returned in JSON or CSV
I think this is the solution if it’s okay that the results are returned in JSON or CSV
As suggested by @austin, on Google Sheets, it might be possible to access using Basic Auth (not recommended for large volumes) or the with PAT using Google’s script engine. I’ve not tried this but it’d be a great thing to learn! ![]()
ok thanks,
actually, we have lots of pivot tables i dhis2 every quarter we generate those reports and then we summarize those by create chart and other analyzation. and then shift that into the quarter report which is quite time consuming therefore i want to create template and connect all pivot with excel and then excel with chart and all then link that with Ms. Word which is quite help our team to prepare fast and accurate report still i will try if could do otherwise i will also share my concern with @austin if he could help me in this regard.
AL-Gassim thanks for your cooperation and response much appriciated.
So the template will be more like a pivot of a pivot?
It is possible to create more indicators and generate this pivot in the Data Visualizer app so you’d not need to return to Excel?
