DHIS2 Issues - data entry and data visualizer

Dear DHIS2 Community,
I have an ussue concerning data entry/data visualizer.
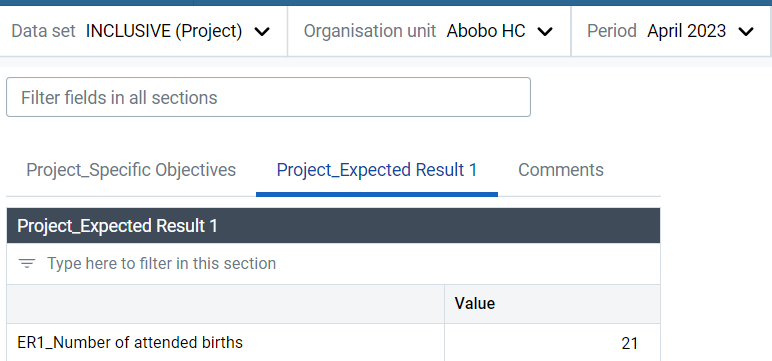
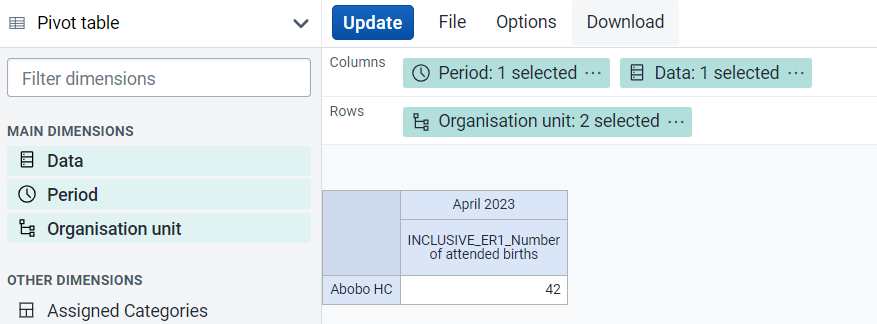
The two screenshots below explain the type of weird discrepancies the team here has been experiencing. When generating the same pivot today, the same ‘42’ figure appears for April at Abobo HC, despite having ‘21’ on the entry page (both run at the same time). What is the technical problem ?
image

image_2

Thank you in advance for your support,
Paolo

Hi @p.belardi
It seems either you have wrong calculation, possibly the indicator somehow calculates wrong, or you have entered the same value in 2 different organisations.
Please check both

Regards,
Ulanbek

Hi @p.belardi

  1. Indicator vs. Data Element: If the discrepancy is seen while using an indicator, it’s essential to review the formula or configuration of that indicator. Mistakes in the calculation, such as incorrect aggregation levels or wrong data elements included in the formula, could lead to incorrect data being displayed.
  2. Data Element: If the issue concerns a data element directly, ensure that the data is being entered and reported correctly at the right organizational levels. There could be a misconfiguration or misunderstanding regarding which organizational unit the data should be associated with.
  3. Organizational Unit Configuration: Sometimes, data might be aggregated or inherited incorrectly from other organizational units, especially if the organizational hierarchy has been configured or edited recently. This can result in figures being pulled from adjacent or parent units inadvertently.