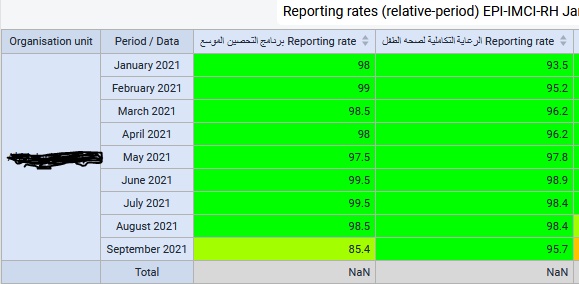
I want to display the rows or columns totals with reporting rates data, can you help me how to do that in pivot table app or the visualizer
Hello @Ahme7d,
Thank you for your question! Would you please show a screenshot with an example of the table you are trying to create? Thank you!
Thanks @Gassim for your quick response.
I know it’s percentages but my qustion is how can we disply the totals of a percentages in pivot table (if it possible !)
Hey @Ahme7d,
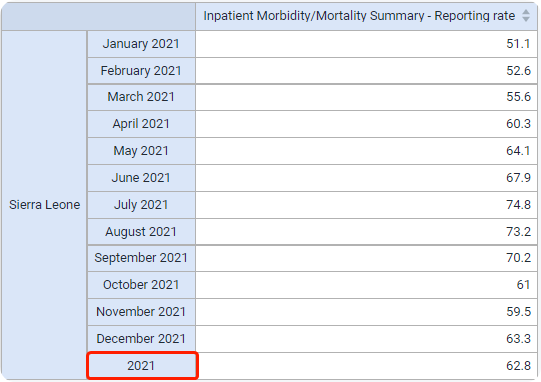
You’re welcome, and you thank you for the screenshot! Like you said it doesn’t seem possible to “sum” the percentages; however, it is possible to add a period that has the total of all the periods in the table. For example,
If you can’t find the proper period to select and would like to get the total like you displayed in the table then maybe you can create a Jira feature request on jira.dhis2.org
Thank you! (: