In the data visualizer when I choose the period for more than a year an error message appears as following:
Something went wrong
There was a problem getting the data from the server.
But if I select the period on one year or less for example last 3 months that visuals appears normally.
Please help.
Would it be possible to test which exact period results with this error? For example, if you pick fixed months from January 2023 - February 2024 keep adding a fixed month until the error appears and then try that month alone. What I mean by this is so you could figure out for which period is this happening exactly and see that you actually have data there.
When you figure out the exact period that’s causing this issue, it might also help to check the console and network tabs in the DevTools (F12) then share screenshots please.
Hi @Gassim we just noticed its happening irrespective of time interval when data is not present. But at times even when data is not present it does not give the error.
We are in version 2.37.9.1. Can you explain in which use cases this error is thrown?
Select a period which doesn’t have any data (I choose may 2015)
Click on update it would show ->No data available. The selected dimensions didn’t return any data. There may be no data, or you may not have access to it.
Once updated click on save then we get-> Something went wrong. There was a problem getting the data from the server.
Hi! this is Tariq Khan from Pakistan, I am new to this platform.
I have some suggestion which may be resolve the data visualizer error message.
As per my experience this issue appears by two reason.
If there is some updates/work running on DHIS2 Plat Form/Portal by the DHIS2 administrators. the data visualizer may give this message.
If the data visualizer in DHIS2 gives this error message you may clear the browser Cache data or system cache data will resolve this issue.
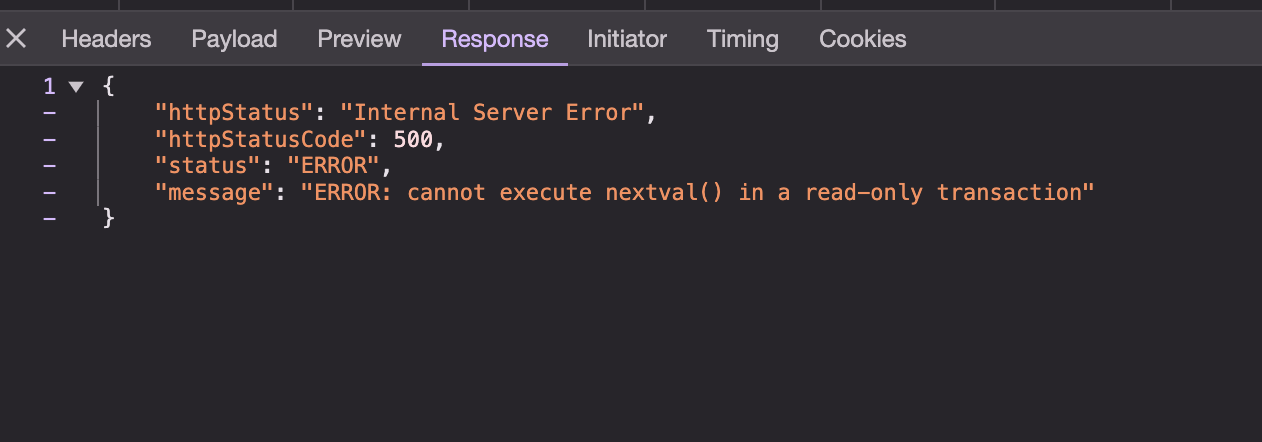
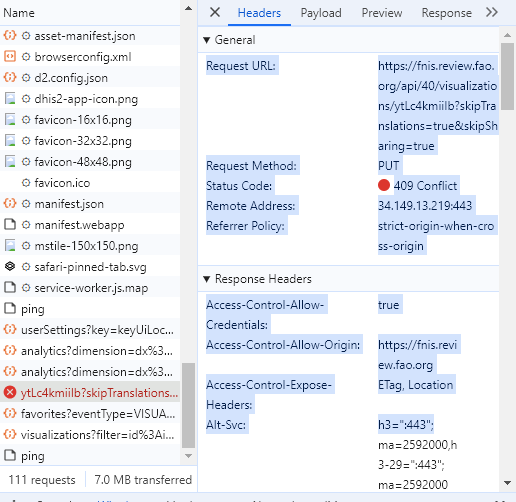
Now I am having the same issue but this time when selecting more than 6 periods in the visualizer, and am getting this message issue in the network console here I am attaching the screenshot, knowing that I have deleted the cache of the browser
It seems this could be a server/database issue, so to understand what’s going on further please share the full Catalina.out log (make sure to remove the authentication/sensitive info from the log).
As you mentioned it could be server/database issue, I have restarted the database from the cloud server shell command and it worked, but please keep in mind that is issue is happening to me from time to time and suddenly, will keep you updated once I get this issue again
Sure, yes usually clearing server cache and restarting resolves the issue. This might have to do with the server configuration and memory as well. If it occurs again, check the error log in the Catalina.out. Thanks!