Hi team,
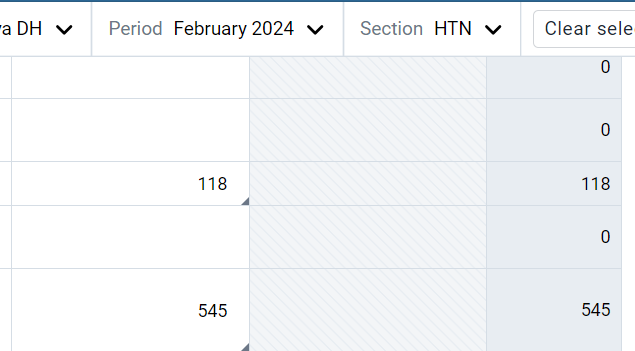
I am using data exchange app for Tracker to Aggregate data exchange. When I check the data exchange app for each data element, the data element has the got the correct values.
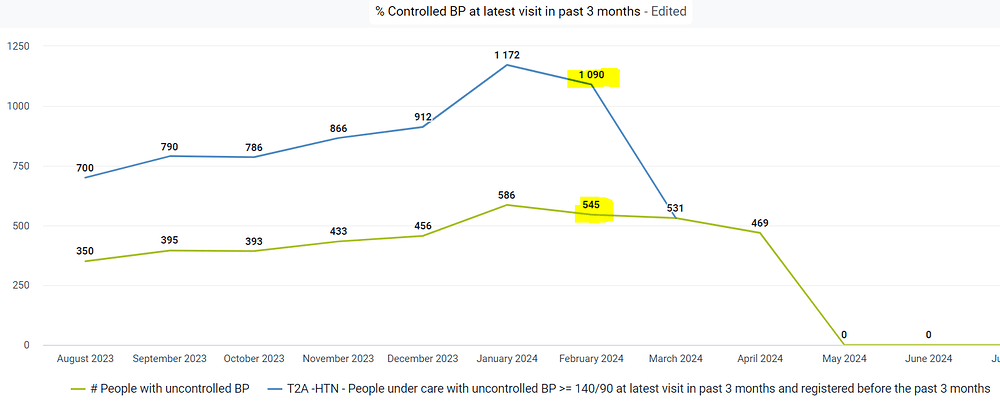
- For an example: February 2024, this data element has the value of 545. But when I use data visualizer app to check the values of past few months, the values have been doubled.
- Please refer to the data visualizer comparison of the program indicator and the data element.
What could be the cause of this?


