THE SCENARIO
I have 5 level organization units from top to bottom like:
Level 1 - State
Level 2 - LGA
Level 3 - Ward
Level 4 - Community
Level 5 - Facilities with 300+ facilities as FAC at level 5
Also I have three organisation unit groups as OUG1, OUG2 and OUG3.
The dataset have 180 data elements DE1, DE2, DE3, DE4, DE5…DE180 divided into sections.
Section 1 have 80 questions or DEs. Out of these 80, 54 has maximum score of 1 for each DE others are not scored. So when a user fill the form the maximum score they can get for this section is 54*1 = 54.
Suppose FAC 1-110 belongs to OUG1, FAC 111-200 belongs to OUG2 and FAC 201-300 belongs to OUG3.
The total score of DE value that FAC 1-110 in OUG1 can have is 54 with SUM as aggregateType for the data element. I also set the DE aggregateLevel as 5 which is the lowest OU. Data is collected at level 5 of the OU.
WHAT WE WANT
- We need an indicator to aggregate the score of the facility for this section one using the aggregate sum of the score of the facility out of the 54 expected maximum score as numerator and 54 as denominator. I define my indicator as below. So for each facility,
Numerator = DE1 + DE2 + DE4 + DE5+…+DE54
Denominator = 54
Indicator type is percentage.
Manually when I take the total DE score aggregated at level 5 from the 106 facilities that submitted data among the 110 FAC in OUG1 as numerator and divide it by the 106 times 54, multiply by 100, I got the expected result.
ie 106 * (score from each facility) / (106 * 54) * 100
In which case no facility can have more than 54 score.
- So the next requirement is to aggregate the indicator result at the level 1 using average of the percentages scores from level 5.
I will use the 2 case scenario below to explain the different result I am getting. I created a visualizer for the percentage indicator from the OUG1 facilities called Section 1 Indicator and use average as aggregation type. I have a slightly different result depending on the setting of the parameter queries.
For confidentiality, I will blank out name of facilities or DEs. For both visualizer settings below:
i. Data represent the Section1 Indicator which is (facility score / 54 * 100)
ii. Period is quarterly
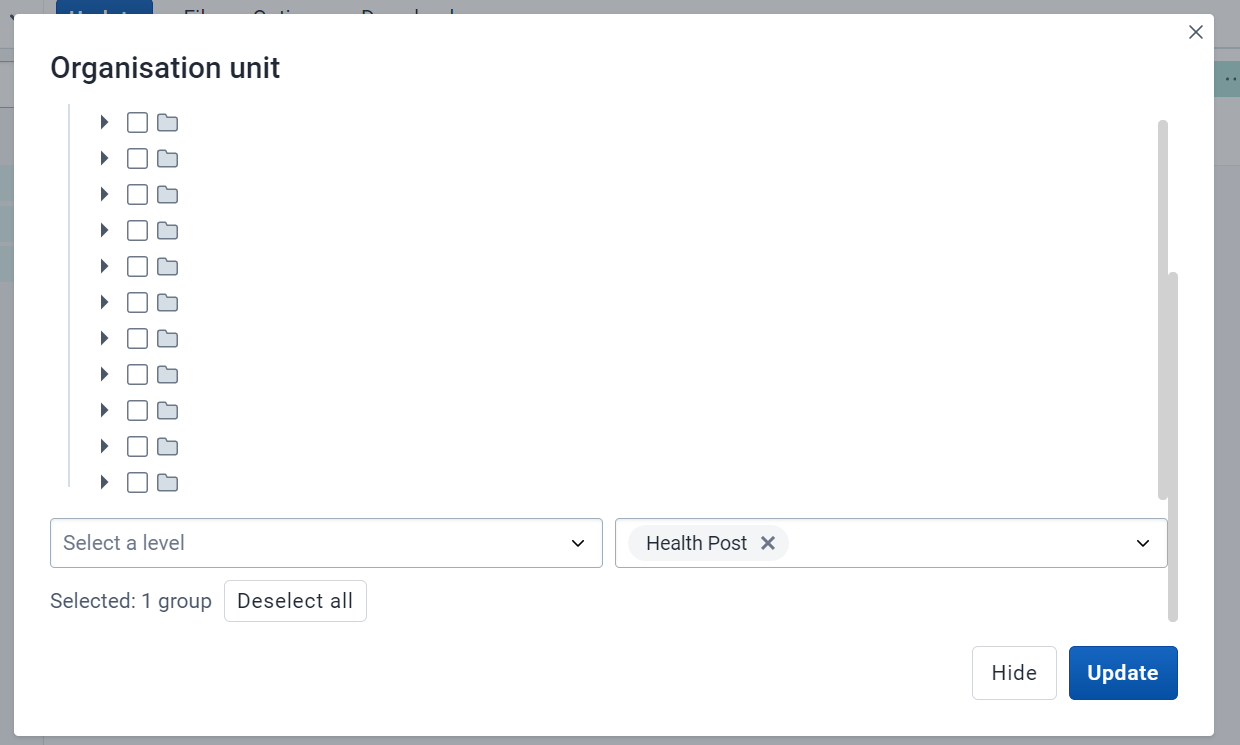
iii. Organisation Unit is all facilities filterd by OUG1 i.e Health Post like below
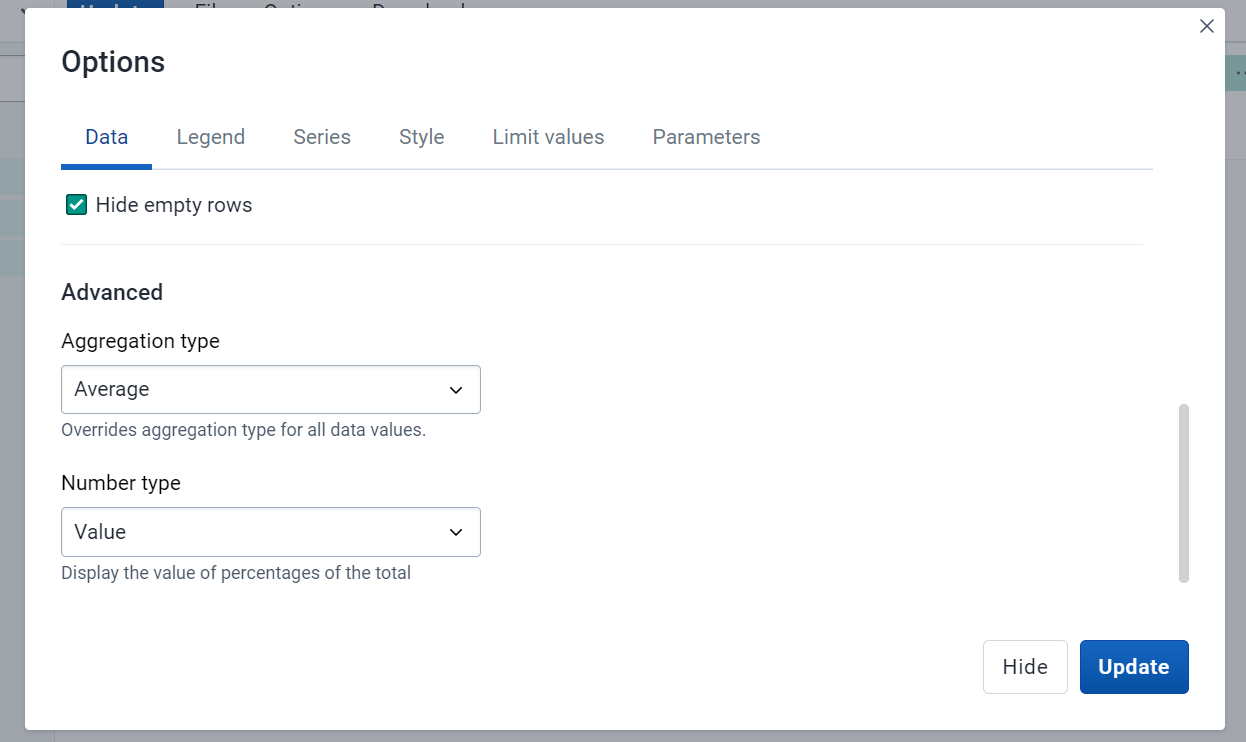
iv. Under Option tab I select Average for Aggregation type. Tick Column total and Hide empty row like below:
SCENARIO 1 RESULT - Using organisation unit as Filter
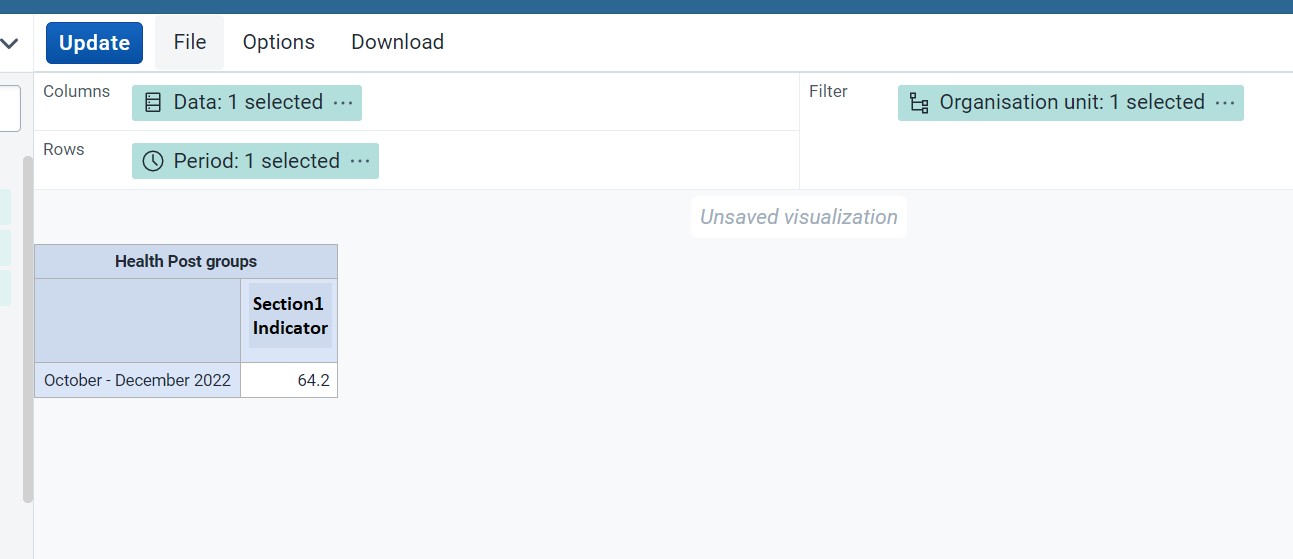
The above image is the result for section1 indicator from OUG1 (Health Post groups) facilities.
In this case I put the Data under Column, Organisation Unit under Filter and Period under Row. The Section1 Indicator or average percentage score return 64.2%.
SCENARIO 2 - Using organisation unit as Row
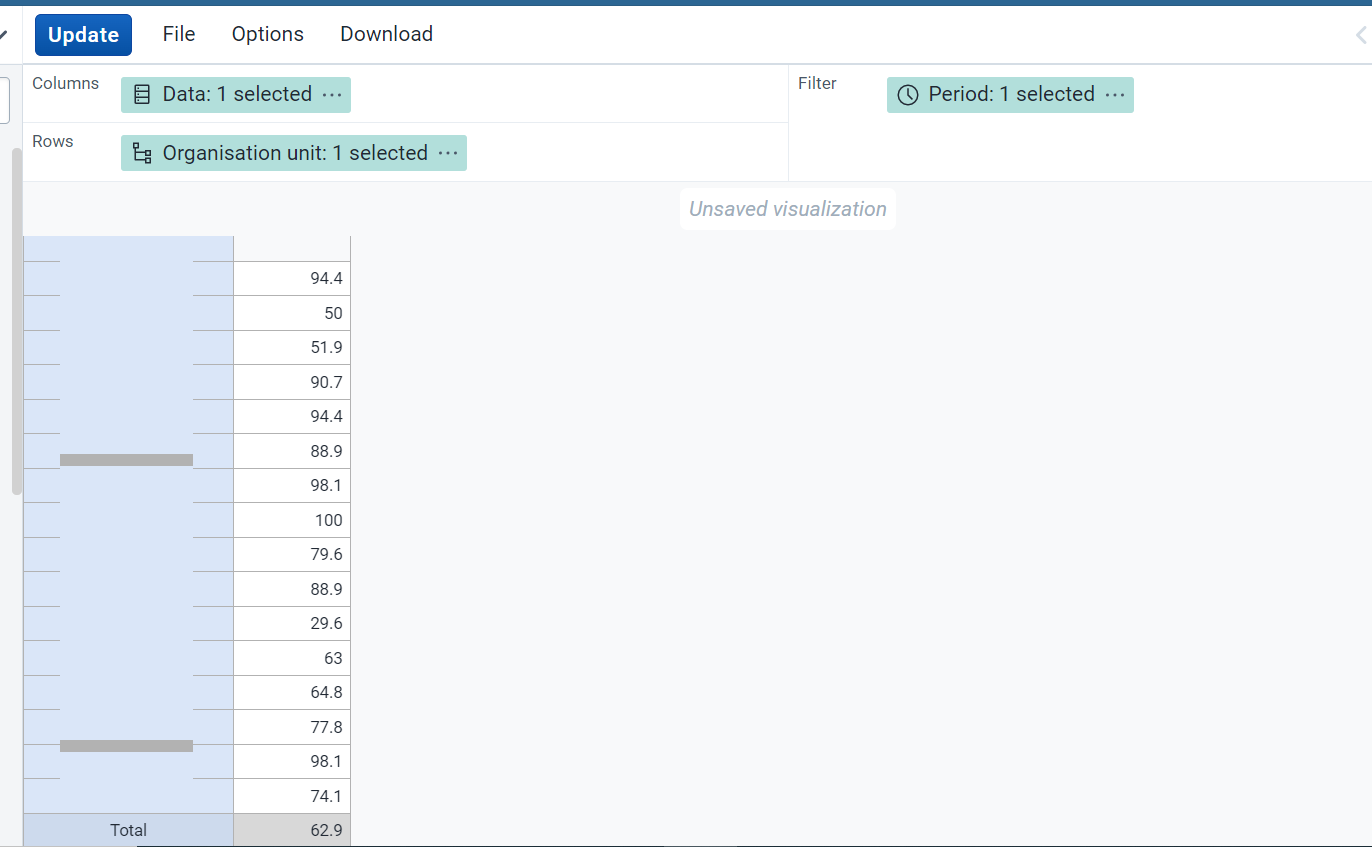
The above image is the result for section1 indicator from OUG1 (Health Post groups) facilities. In this case I put the Data under Column, Organisation Unit under Row and
Period under Filter. The Section1 Indicator or average percentage score return 62.9%.
Significantly just by changing the position of the organisation unit, I got 1.3% in the value different. Meanwhile when I did a manual calculation of all the scores and divide by the expected denominator I got the 62.9% of the Scenario 2.
MY TAKE
-
Scenario 2 is the correct expected result. However, to get this result as a visualizer at level one you will need to move the OU to Row which will list all the facilities. But in our use case, we just wanted the aggregate result at the State level which is level 1. That is we want to be able to hide the facilities and see the result only for the state.
-
I am also curious as to how the system arrive at the 64.2% result when the OU is moved to the filter. I have tried all possible cases manually but couldn’t arrive at this result.
-
How does moving the organization unit from Row to Filter impact on aggregation at the top level i.e level 1?