Hi @phil please I need assistance for a little challenge.
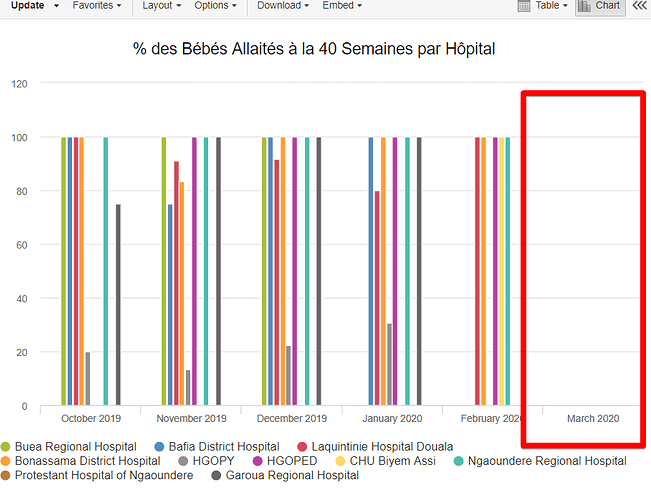
What happens went you do a data visualizer analysis for an indicator, it displays for all months as selected under period but a particular month does not display its results. But data has been collected for that month. This can be seen in the attached screenshot.
Thanks and waiting
Hi @Lionel_Che33,
There is an additional period ‘this month’ that you can add to your period dimension. The same applies for weeks, and years. Could that be your solution?
Has the latest data been pushed to the analytics tables?
Hi @YuryR,
Thanks for this.
I already checked the option of this month, in my period dimension and perform analytics tables under data administration and yet no changes.
Sometimes it helps to clear analytics tables, delete application cache and update analytics tables again. Deleting browser cache is also recommended.
Try recreating the chart in data visualizer with other parameters for testing.
Also, check Analytics Period Boundaries for your indicators.
Hi @YuryR,
Thanks for this.
I already checked the option of this month, in my period dimension and perform analytics tables under data administration and yet no changes.
