In Rwanda we are trying to use the DHIS-2 platform for a national data warehouse and dashboard. This stores historical data on selected (key) indicators going back for more than 10 years. Generally the exercise seems to be working well, but we have just noticed an issue regarding the Data Visualizer module: the period selector tool does not allow us to show data going back that far, and we cannot view more than 12 months of monthly data.
Would it be possible to modify this dialog so that we can give a date range: from 1/1/2005 to 31/12/2011 and then specify whether we want the data disaggregated quarterly, monthly or annually? Most of our data values are monthly – however we also have entered selected indicators from the DHS (survey data collected every 2 or 3 years).
we have already implemented custom period selection in data visualizer in trunk and it will be part of the 2.9 version which will be released this week.
best regards,
Lars
···
On Mon, Jul 23, 2012 at 11:42 AM, Wilson,Randy rwilson@msh.org wrote:
In Rwanda we are trying to use the DHIS-2 platform for a national data warehouse and dashboard. This stores historical data on selected (key) indicators going back for more than 10 years. Generally the exercise seems to be working well, but we have just noticed an issue regarding the Data Visualizer module: the period selector tool does not allow us to show data going back that far, and we cannot view more than 12 months of monthly data.
Would it be possible to modify this dialog so that we can give a date range: from 1/1/2005 to 31/12/2011 and then specify whether we want the data disaggregated quarterly, monthly or annually? Most of our data values are monthly – however we also have entered selected indicators from the DHS (survey data collected every 2 or 3 years).
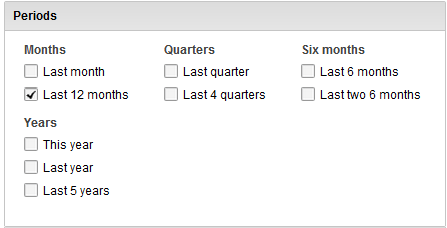
in 2.9 (will be out soon) you can select fixed periods in addition to the relative ones in your picture. This allows you to go back in time as far as you want. Can be tested here:
On Mon, Jul 23, 2012 at 11:42 AM, Wilson,Randy rwilson@msh.org wrote:
In Rwanda we are trying to use the DHIS-2 platform for a national data warehouse and dashboard. This stores historical data on selected (key) indicators going back for more than 10 years. Generally the exercise seems to be working well, but we have just noticed an issue regarding the Data Visualizer module: the period selector tool does not allow us to show data going back that far, and we cannot view more than 12 months of monthly data.
Would it be possible to modify this dialog so that we can give a date range: from 1/1/2005 to 31/12/2011 and then specify whether we want the data disaggregated quarterly, monthly or annually? Most of our data values are monthly – however we also have entered selected indicators from the DHS (survey data collected every 2 or 3 years).
Some guidance: the period panel is now split into relative periods and fixed periods. Go to relative periods, uncheck last 12 months, go to fixed periods and make you selection. Mixing relative and fixed periods should also work fine.
···
On Mon, Jul 23, 2012 at 11:45 AM, Lars Helge Øverland larshelge@gmail.com wrote:
Hi Randy,
we have already implemented custom period selection in data visualizer in trunk and it will be part of the 2.9 version which will be released this week.
best regards,
Lars
On Mon, Jul 23, 2012 at 11:42 AM, Wilson,Randy rwilson@msh.org wrote:
In Rwanda we are trying to use the DHIS-2 platform for a national data warehouse and dashboard. This stores historical data on selected (key) indicators going back for more than 10 years. Generally the exercise seems to be working well, but we have just noticed an issue regarding the Data Visualizer module: the period selector tool does not allow us to show data going back that far, and we cannot view more than 12 months of monthly data.
Would it be possible to modify this dialog so that we can give a date range: from 1/1/2005 to 31/12/2011 and then specify whether we want the data disaggregated quarterly, monthly or annually? Most of our data values are monthly – however we also have entered selected indicators from the DHS (survey data collected every 2 or 3 years).
Some guidance: the period panel is now split into relative periods and fixed periods. Go to relative periods, uncheck last 12 months, go to fixed periods and make you selection. Mixing relative and fixed periods should also work fine.
On Mon, Jul 23, 2012 at 11:45 AM, Lars Helge Øverland larshelge@gmail.com wrote:
Hi Randy,
we have already implemented custom period selection in data visualizer in trunk and it will be part of the 2.9 version which will be released this week.
best regards,
Lars
On Mon, Jul 23, 2012 at 11:42 AM, Wilson,Randy rwilson@msh.org wrote:
In Rwanda we are trying to use the DHIS-2 platform for a national data warehouse and dashboard. This stores historical data on selected (key) indicators going back for more than 10 years. Generally the exercise seems to be working well, but we have just noticed an issue regarding the Data Visualizer module: the period selector tool does not allow us to show data going back that far, and we cannot view more than 12 months of monthly data.
Would it be possible to modify this dialog so that we can give a date range: from 1/1/2005 to 31/12/2011 and then specify whether we want the data disaggregated quarterly, monthly or annually? Most of our data values are monthly – however we also have entered selected indicators from the DHS (survey data collected every 2 or 3 years).