I am facing data is not appearing in pivot tables/charts in a DHIS2 2.39.8. I have imported data values for various org units for November 2024 into the instance and confirmed that they are on the system, but after running analytics the data is not displaying for org units in any of the Analytic tools pivot table or data visualizer.
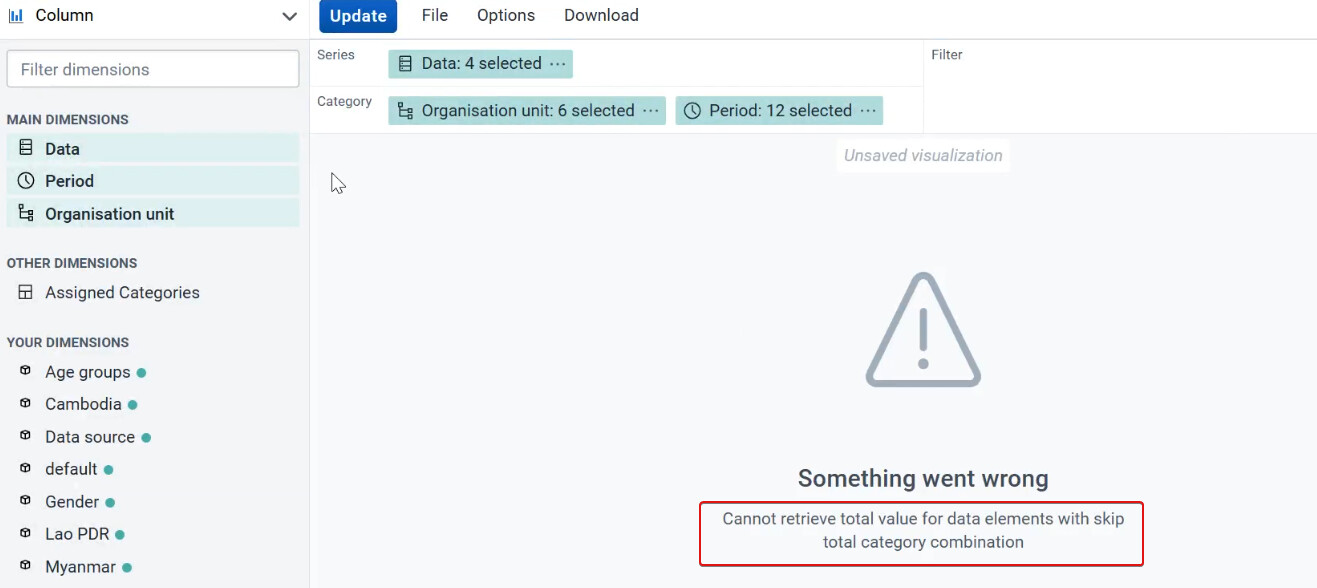
I have checked to confirm that my pivot tables/charts are not using relative periods, I have cleared my browser cache and also use incognito mode, I have done a data value download via the APIs (http://172.105.113.143:8082/239_8/api/dataValueSets.json?dataSet=o8nx6p368K6&startDate=2024-11-01&endDate=2024-11-30&orgUnit=j8zBxz9Vbfw&children=true) to confirm that there is data for those particular data sets. My analytics tables are set to not skip anything and the values still don’t display on the data visualizer. I also followed these 3 steps: 1). Maintenance, 2). Resource Tables, 3). Analytics Tables. Nevertheless, still November 2024 I have imported does not appear.
Could you please assist what I should do to solve this issue?
Sorry I will need to ask you more questions to understand the issue better.
Does this also happen to a superuser with ALL access? Could you also try the browser’s Guest mode instead of incognito?
Are there any errors when running analytics tables export? Please also check the Catalina.out log for any errors.
So you’re able to access the data using the API, and what about the Data Entry app? If you open the dataset using the same dimensions, are you able to find the same values as the API?
What is the version of the Data Visualizer app that you are using? Would you use the App Management app to update it to the latest version if it’s not already?
For the same OU and dataset, are you able to find the data for these values before November when using the Data Visualizer app?
Well, I’m using super user so of course this also happens to a super user that I’m using. I’m testing in Guest mode in Chrome, but seem everything the same (please see my screenshot in Guest mode).
I don’t see any errors in running analytics tables (please check catalina_log file).
Of course, I can access data value through API (please see attached result screenshot). I don’t use data entry form since data is pushing from another DHIS2 instance in csv format (please see attached csv file).
The data visualizer app I’m using is default data visualizer app in dhis2 2.39.8. I tried to check in App Management if there is any update, but I don’t see this Data Visualizer app available there (please see attached screenshot).
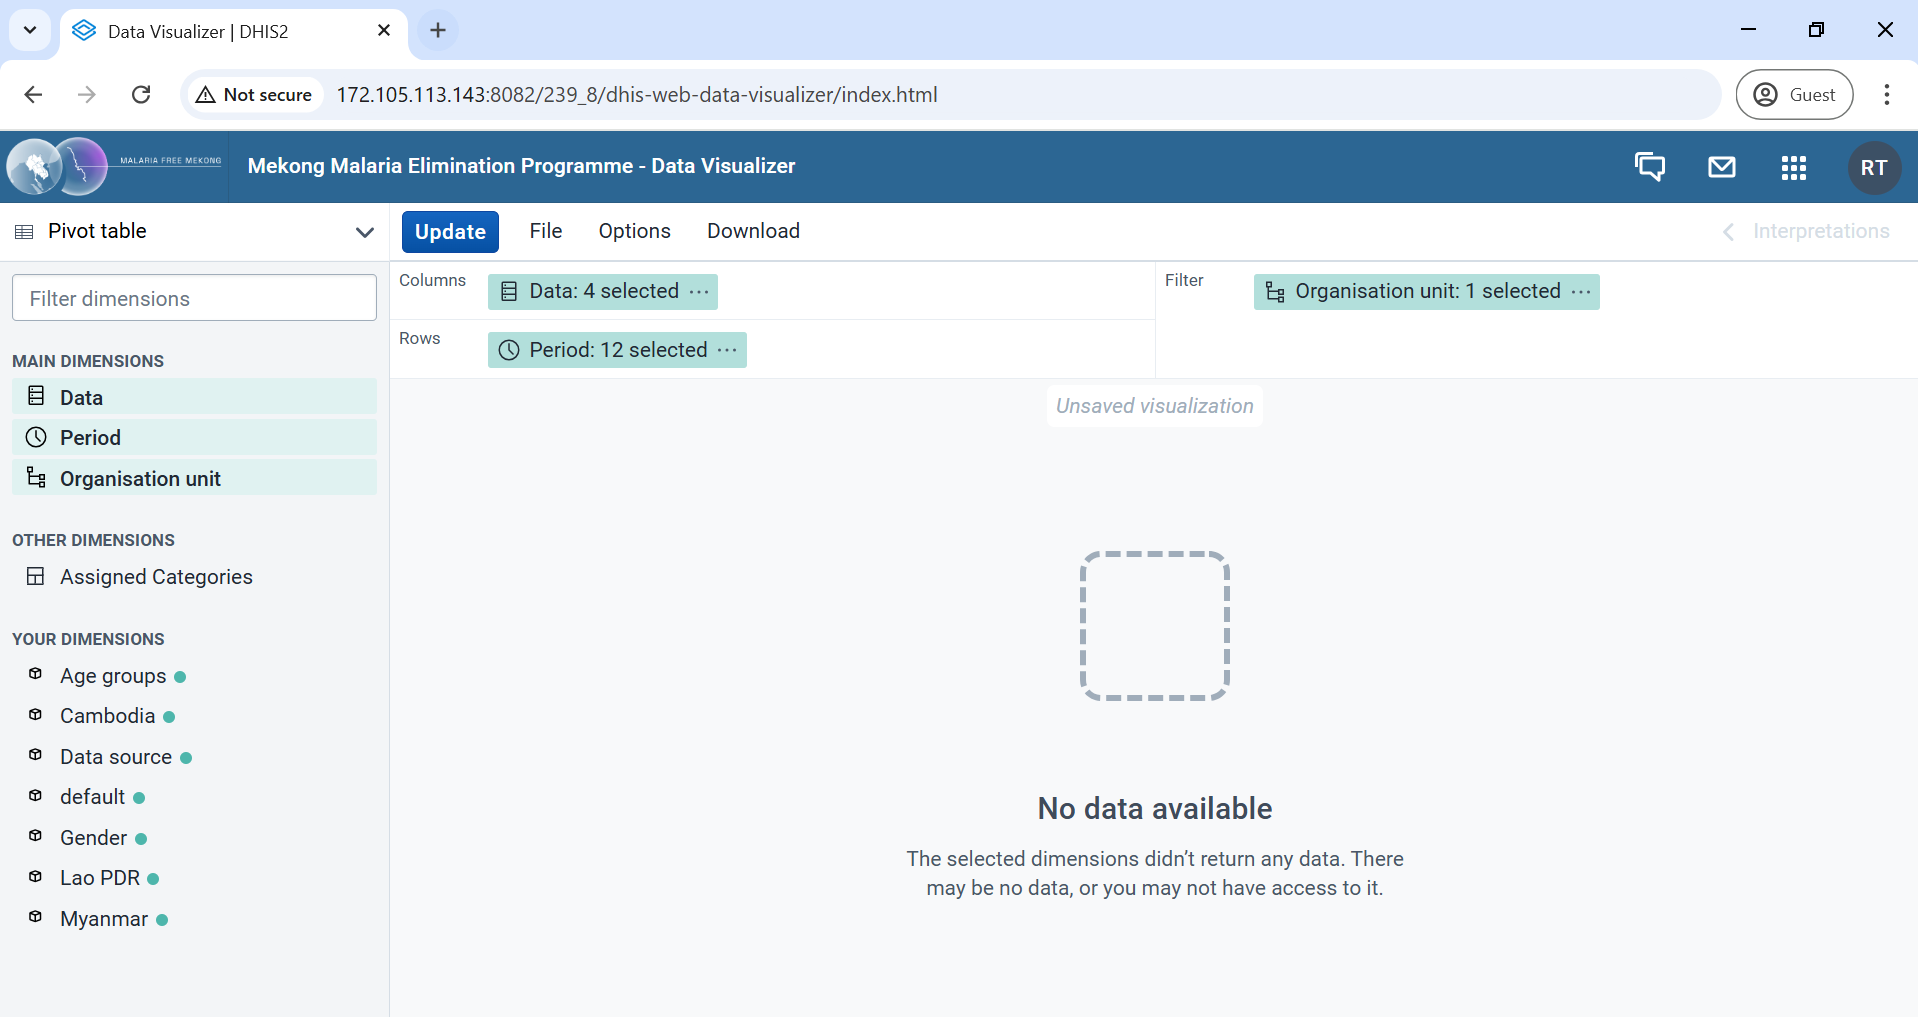
No, data before November 2024 is also not appearing.
I also tried setting schedule in dhis2 to run at a specific time I need just to test whether it works, but still no luck after scheduling running comletely. It is so weird.
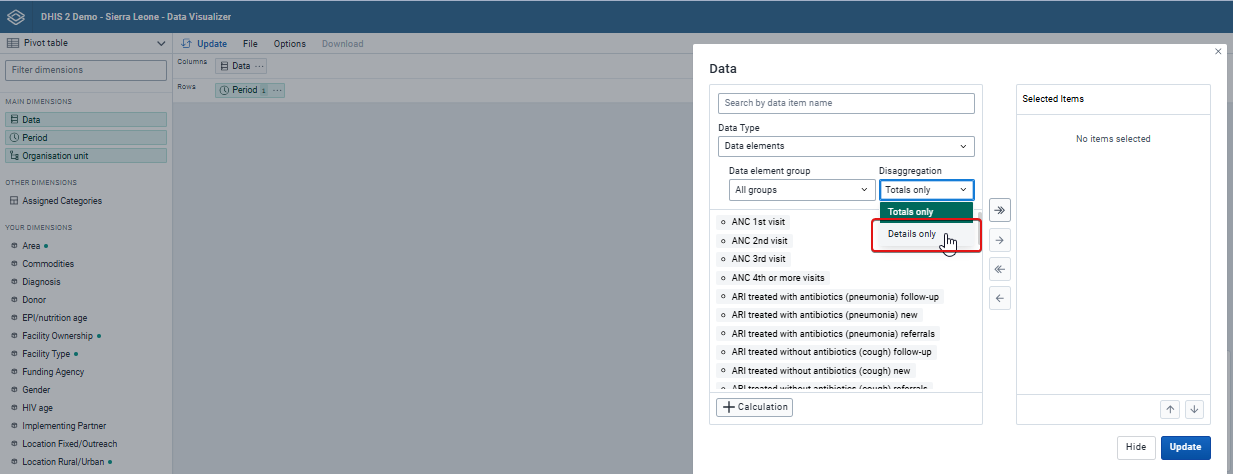
Thanks for advice for the next step. I tried by selecting Details only, but still nothing appears.
I’d like to update you as well. If I wait Schedule at mid night at 3AM to run, data comes out in pivot/chart. I’m really curious how it is different between running analytics tables manually or set scheduling for time we wish it to run as I shared with you in video screen record earlier.
Yes, that’s right. I also tried changing the time of schedule from 3AM to the time I need and after completion, sometimes data shows up, sometimes it does not show up. I’m really curious the reasons behind.