Many thanks for the questions @kstankevitz (and @Gassim). I’m one of the developers of the app, so I can hopefully provide a few answers. As Gassim notes this app is quite new and we are actively trying to improve it, so we appreciate the feedback. Apologies for the delay in response as I was out on vacation last week.
Is there a way to trigger the PIs to be evaluated in the actual Data Exchange app?
Since program indicators should be evaluated on the fly, when you open the exchange before submitting, I believe you should see the calculated results in the preview mode before hitting submit. If you are not seeing the data, it might be a good idea to check the mappings. We did an internal training that has an overview of configuring the app and setting up mappings: DX Demo - Hoi An April 2024.mp4 - Google Drive
As Gassim notes, once you see the data, hitting “Submit data” should be sufficient to trigger from within the app. If you’re not able to click on “Submit data”, you might need to update the sharing on the exchange.
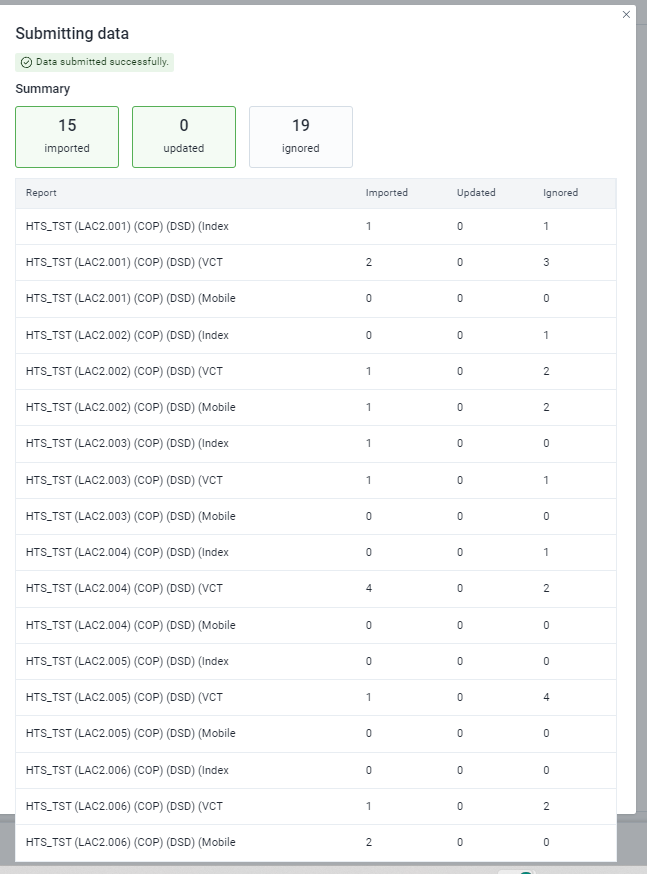
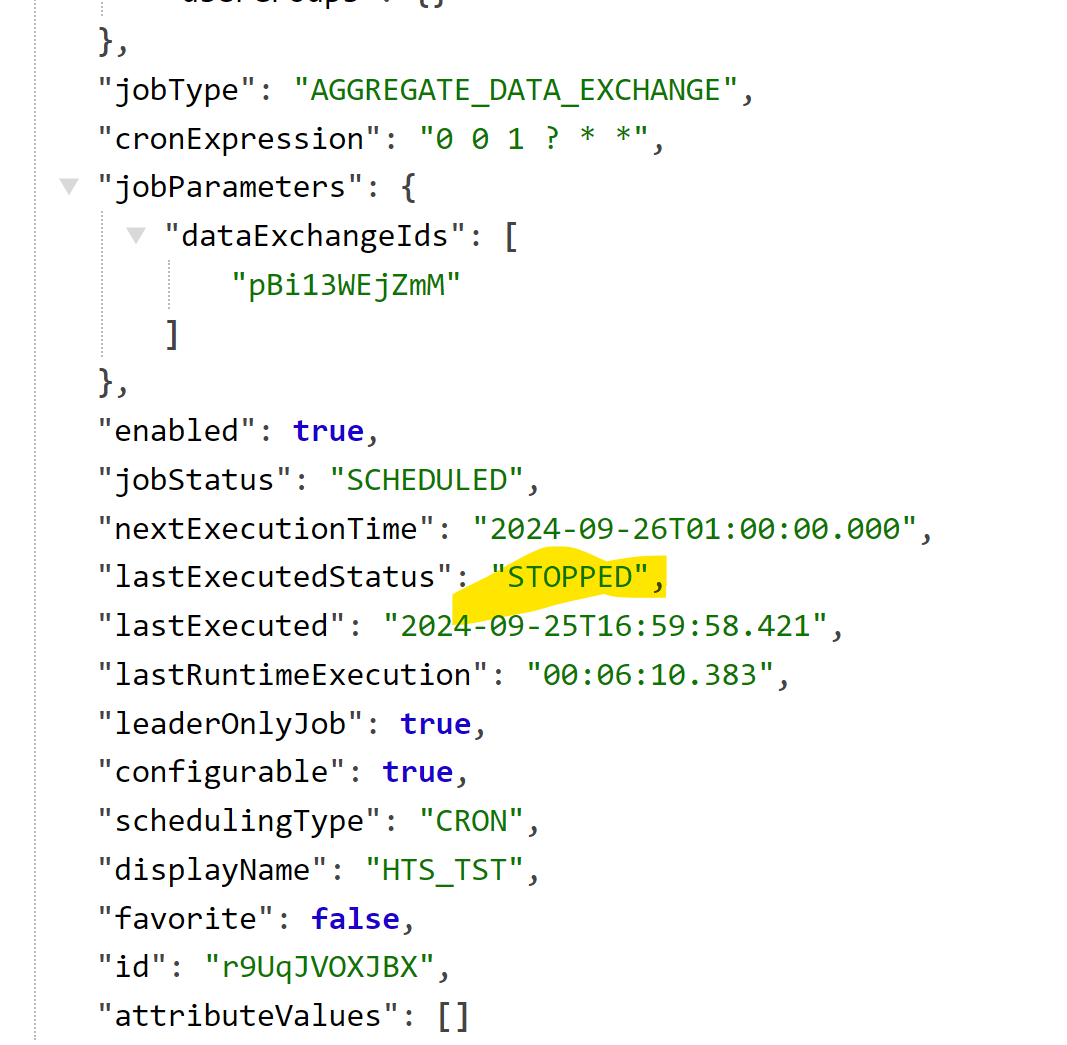
I can verify the scheduled job completed successfully a few mins ago via the API, but it still says “Source data was generated 15 hours ago.”
The statement "Source data was generated 15 hours ago." actually refers to when analytics tables were last generated, which would be relevant for aggregated data. We struggled with a way to convey this information within the app. We considered an alternative like “analytics tables were last generated 15 hours ago” but thought that required to much knowledge about the inner workings of DHIS2.
If you have any suggestions for how this language might be made clearer (or explained better in the documentation), please let us know.
I have it configured to use an attribute for the data element ID, but every time I click Submit data, it gives me an error because its trying to use the id of the program indicator as the DE ID.
In version 41 onwards, we have updated the data exchange service to provide a Data item ID scheme which applies to data elements, indicators, and program indicators. This is selectable in the latest version of the app:
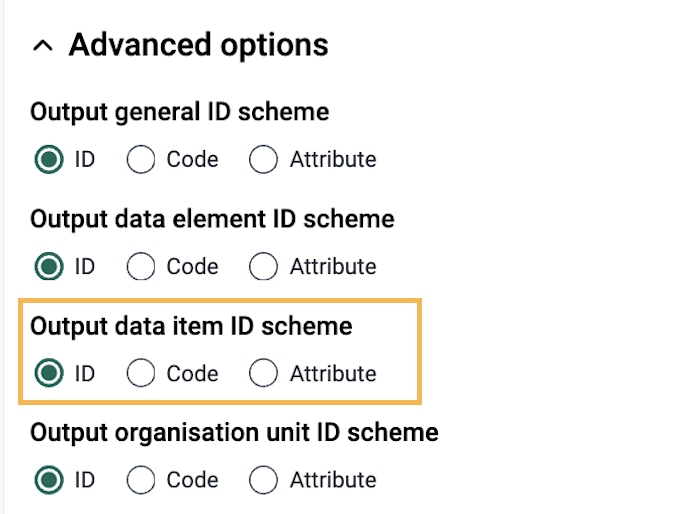
The data element ID scheme applies specifically to data elements.
Another potential bug is if you create a cron job for data exchange, then you delete one of the exchanges applied to that job, it doesn’t delete from the backend.
I will bring this point up with the backend team. I am not sure if we intend to restrict removal of metadata objects if they are associated with cron jobs.