I deleted a custom dataEntryForm and change the formType from CUSTOM to SECTION. I created all the sections.
When I open the dataSet with the old Data Entry app, everything look and works fine.
But when I open the dataSet with the Data Entry (Beta) app the page is showing error.
When I check the technical error on the page I got:
TypeError: Cannot read properties of undefined (reading 'displayFormName')
    at https://domain.org/dhis-web-aggregate-data-entry/static/js/app.af90f008.chunk.js:1:425748
    at Array.filter (<anonymous>)
    at Xd (https://domain.org/dhis-web-aggregate-data-entry/static/js/app.af90f008.chunk.js:1:425726)
    at ea (https://domain.org/dhis-web-aggregate-data-entry/static/js/main.9d97de8f.js:2:280863)
    at Es (https://domain.org/dhis-web-aggregate-data-entry/static/js/main.9d97de8f.js:2:327088)
    at Ol (https://domain.org/dhis-web-aggregate-data-entry/static/js/main.9d97de8f.js:2:319835)
    at Sl (https://domain.org/dhis-web-aggregate-data-entry/static/js/main.9d97de8f.js:2:319760)
    at gl (https://domain.org/dhis-web-aggregate-data-entry/static/js/main.9d97de8f.js:2:316762)
    at https://domain.org/dhis-web-aggregate-data-entry/static/js/main.9d97de8f.js:2:268141
    at https://domain.org/dhis-web-aggregate-data-entry/static/js/main.9d97de8f.js:2:393205
Before I made these changes and delete the custom form, the Data Entry (Beta) app was showing the custom form.
This capture what I did and land in trouble. I noticed when I checked the fields for the dataset schema, there is no displayFormName field. But when I copied the dataset from my api the field is added with the name of the dataset.
I deleted it and upload it back but the field always come back when I fetch the dataset with api. I checked the database with sql query and the field is not there. So where is it coming from when I fetch with api?
Error: Cannot read properties of undefined (reading 'displayFormName')
    at indicators-table-body.js:18:28
    at Array.filter (<anonymous>)
    at Xd (indicators-table-body.js:17:41)
In the file the problem comes from
const name = indicator.displayFormName.toLowerCase();
Right now, I have deleted all the indicators in the section of the dataset.
@jetisco4u: does removing the indicators solve your issue? If you’re able to recreate the problem on play/dev, we can take more of a look.
The displayFormName property for an indicator isn’t related to the form type; it’s a property on indicator, and since we don’t expose that property in the maintenance app, it should just match the displayName. You might want to check the response from api/indicators?fields=id,displayName,displayFormName to see if there’s indicators where displayFormName is not being populated.
Removing the indicators from the sections doesn’t solve the issue.
I checked the response from the api, all the indicators have displayFormName. In fact I used the same value in displayName for displayFormName. Meanwhile it should be noted that the displayFormName that comes from the dataset api is different from the ones in the indicators.
Hmm. That’s interesting. Since the error is that it cannot find displayFormName on undefined, I would assume that one of the indicators that it’s trying to render is missing in the metadata…but if you have removed all indicators from the data set / sections, then I’m not sure why the code would be trying to render an indicator
If you can clone the data entry repo and run against your local instance, that might be a good way to try to troubleshoot more.
We’re happy to help more, but it’s a bit harder to figure things out when we can’t produce the problem on one of our instances.
I checked the indicators I uploaded and find out that I didn’t add displayFormName field. However, when I fetched with the api, it automatically used the displayName value.
I have indicators attached to the dataSet. I only remove from the sections.
Since the system is replacing the displayFormName with the displayName value, do I need to manually add this to the dataSet indicators array, indicator and section?
Do I need to use the displayFormName of the dataSet as the same for the indicators?
I just clone and run locally. I am getting the same error in the console like
``
caught TypeError: Cannot read properties of undefined (reading ‘displayFormName’)
at indicators-table-body.js:18:1
at Array.filter ()
at IndicatorsTableBody (indicators-table-body.js:17:1)
at renderWithHooks (react-dom.development.js:14803:1)
More
e above error occurred in the component:
in IndicatorsTableBody (created by SectionFormSection)
in table (created by Table)
in Table (created by SectionFormSection)
in SectionFormSection (created by SectionForm)
in SectionForm (created by EntryForm)
in EntryForm (created by DataWorkspace)
in div (created by DataWorkspace)
in main (created by DataWorkspace)
in div (created by DataWorkspace)
in ReactFinalForm (created by FinalFormWrapper)
in FinalFormWrapper (created by DataWorkspace)
in DataWorkspace (created by App)
in div (created by Layout)
I am already looking into this. I console that already and I am inspecting it. So far I can see that const indicators in section.js that was passed as props to indicators-table.body.js return an array of undefined. I am still debugging and will post any challenge I run into.
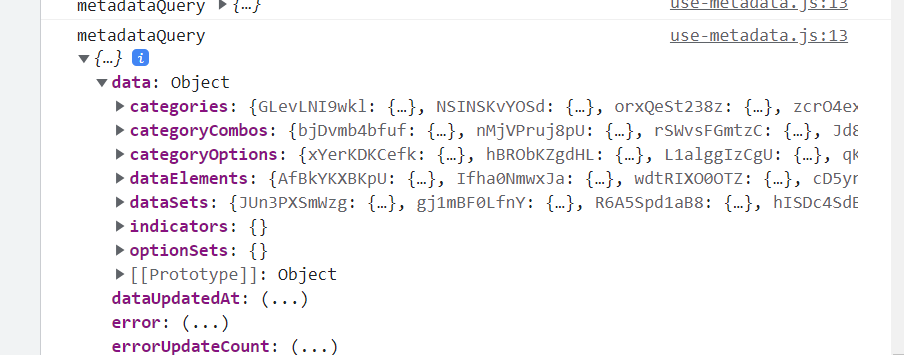
I checked the /dataEntry/metadata endpoint that was fetched at the beginning with in my local and server instance, indicators was an empty object as in the image below.
But when I fetched the api for play.org instance, indicators was fetched along with the metadata. What could be the reason why indicators was not fetched with my metadata?
I also find out that the sections data that was fetched with the metadata come with the indicator ids, but in Maintenance app, I have deleted them. Is there a kind of backup table that the metadata is being fetched from so that I can clear the data?
UPDATE
I deleted all the storage in my system including the serviceWorker. When I reload I see that the /dataEntry/metadata endpoint is now fetching the indicators. On a closer look, the /dataEntry/metadata endpoint sections is still attaching indicators to the fetched sections meanwhile I have deleted it using the maintenance app. Also when I fetched with /api/sections, the indicators are not included. I can’t figure out where the /dataEntry/metadata endpoint is getting the indicators attached to the sections.
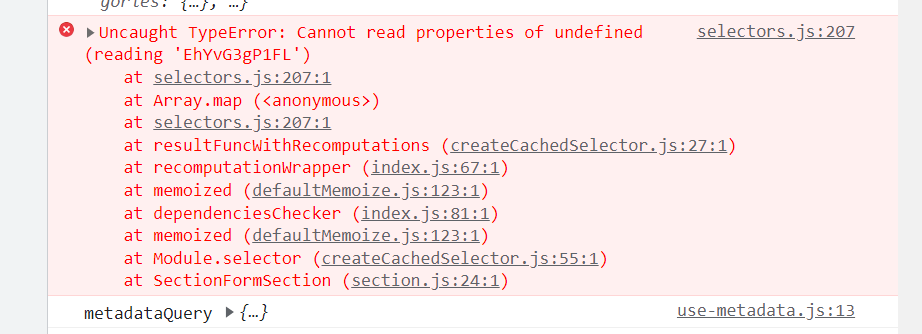
Now it’s throwing new errors. For each of the section indicators I am getting the error below
Which means while the /dataEntry/metadata endpoint sections is still attaching indicators to the fetched sections (from nowhere), the actual record don’t have the indicators. This is a bit confusing.
UPDATED
I cleared my local instant data again and this time the /dataEntry/metadata endpoint is no longer attaching the indicators to the sections. But it took me back to the initial error. caught TypeError: Cannot read properties of undefined (reading 'displayFormName') at indicators-table-body.js:19:1 When I console.log(indicators.length) inaggregate-data-entry-app\src\data-workspace\section-form\section.js` line 34 it returns 0
The component was supposed to only render if indicators.length is greater than zero. In this case it is zero so the component was not supposed to render. So I am wondering why it still render leading to the error.
So I comment out the section below and the form is now rendering
Of course this is in my local environment which means I can use this with the default app that comes with the server instance unless I build and upload the local app
UPDATED
I checked all the sections now and find out that /dataEntry/metadata endpoint still attached indicators to one of the sections. And I have deleted this in the maintenance app. Meanwhile when I check the sectionindicators table in the database, these two indicators record are still there.
From what I discover so far, the challenge is how do I ensure that the indicators deleted from the sections are not fetched with the /dataEntry/metadata api endpoint when fetching dataset?
I will also like to find out whether the /dataEntry/metadata api endpoint fetch data from the database or elsewhere.
Do you want to try recreating that on play/dev now you have a better sense of what is causing the problem (that is, try creating a dataset, then removing the indicators from a section)?
The dataEntry/metadata endpoint should return the updated values from the database, but there may be an issue with the caching there. We’re using an ETag to identify when the metadata object changes so that we only retrieve the metadata when it has been updated.
Ideally, the metadata retrieval should reoccur when you open the app if there’s been a change, but if that’s not occurring, the work around of cleaning the cache should also help.
I could not reproduce this in play/dev as it work as espected.
After I deleted the indicators from sections using the maintenance App, I find out one of the section still has the indicators intact in the sectionindicators table despite that I have deleted it in the maintenance App.
I manually deleted all the indicators in the sectionindicators table from the database. I deleted local storage for both the dev and app and reload the Data Entry (Beta). Still the /dataEntry/metadata api endpoint still fetch the section with the two indicators I manually deleted from the database. It appears that the /dataEntry/metadata api endpoint is fetching from some table other than the section and sectionindicators tables.
UPDATE
I just fetch the metadata with /api/dataEntry/metadata?paging=false and realize that the /dataEntry/metadata api endpoint still fetch the section with the two indicators I manually deleted from the database.
I will like to find out if the endpoint is fetching from a resource table.
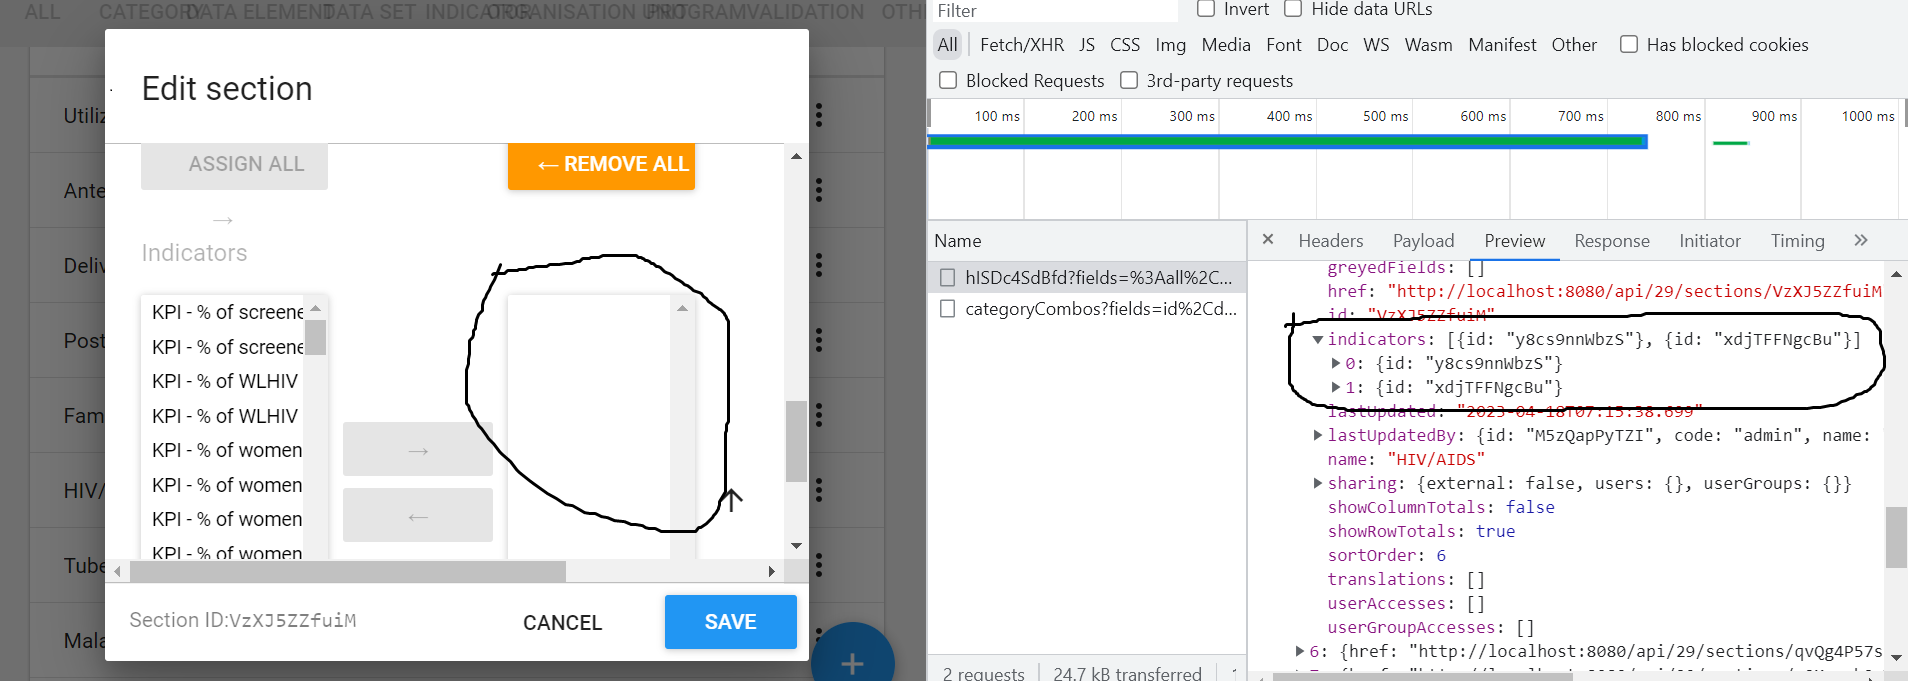
In the image above in the left part, I checked the Data set section management on Maintenance App, from the circle you can see that there is no KPI selected for this section.
In the right though when I inspect the data that was fetched for this section, you can see in the circle that two indicators are assigned to this section.
My question is where is this indicator fetched from? At the end, this is what is causing problem in the Data Entry (Beta) App.