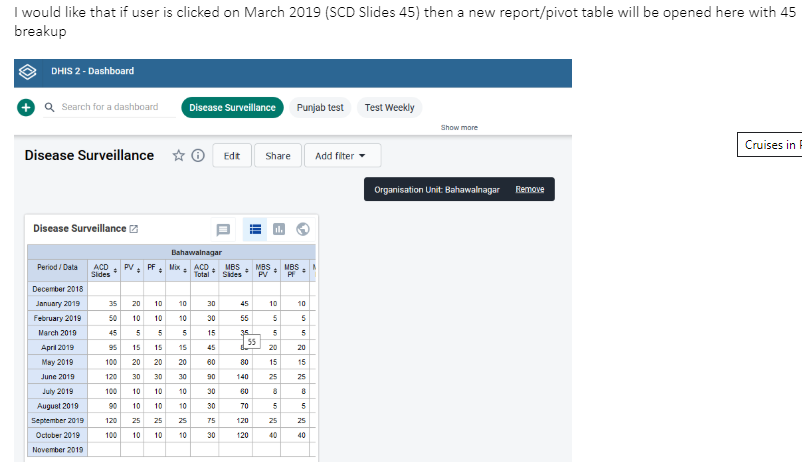
Dear Members
I would like to create a dashboard (bar chart), as I will click on any bar then it will open new report or detail report
How to create it… need help?
Regards
Javed Akram
@jomutsani - any thoughts?
1 Like
Sure, thanks @maxk.
Hi @mrjavedakram,
Welcome to the DHIS2 Community!
Please share a screenshot of what you are trying to do and explain a little bit further for us to know how best we can support you. You can also check out the documentation on DHIS2 Charts and Bar graphs and on the Visualizer App.
I await your response.
Best,
James.
Hi James
Thank you for prompt response
I would like to quote an example here …
We have four provinces and each province has 10 district. We have develop a summary report/chart of HIV AID cases at province level (see below)
Province A 230
Province B 500
Province C 700
Province D 900
As user is clicked on Province A or its value 230 … A new report/ graph will be opened as break up of 230 in Province A (See below - District A,B,C fall in Province A)
District A 100
District B 90
District C 40
I am hopeful that the above illustration is handy for understanding the requirement of drill down reports/dashboards
Waiting for your kind response
Regards
Javed Akram
Hi @mrjavedakram,
Unfortunately this is not possible in the dashboards application. You can use the dashboard filters to drill down into the data in terms of the period, disaggregations, and organizational hierarchy. Using these will not change the data elements or indicators that are shown.
1 Like
Hi Scott
Can we do drill down in pivot table or in any other type of report
1 Like
Hi @mrjavedakram,
Yes, you can drill down in the pivot table application by right clicking on any cell. You can also drill down using the left side data dimensions selection panel. Drill down for pivot tables in a dashboard is only available through the dashboard filters.
Best,
Scott
1 Like