Hi community,
If you are using the DHIS2 Tracker metadata package for Covid-19 surveillance, you may be using the “Relationships” feature to link suspected cases with their contacts. As of v2.33 there are limited features for analytics based on tracker relationships data, making it difficult to trace all the possible links between confirmed Covid-19 cases, their contacts, and their “contacts of contacts”.
To address this gap and support contact tracing efforts, I’ve released a prototype R Shiny app around the Covid-19 metadata package. In short, it analyzes your system’s relationship data across “contact registration” and “case-based surveillance” programs, and displays these in interactive/customizable network diagrams.
- Covid Relationships Explorer Demo here – only works for “covid.dhis2.org/demo” data
- Code available on Github here – free to download, adapt, and host elsewhere (or run in RStudio) with your own system
How might network analysis be practically helpful for contact tracing?
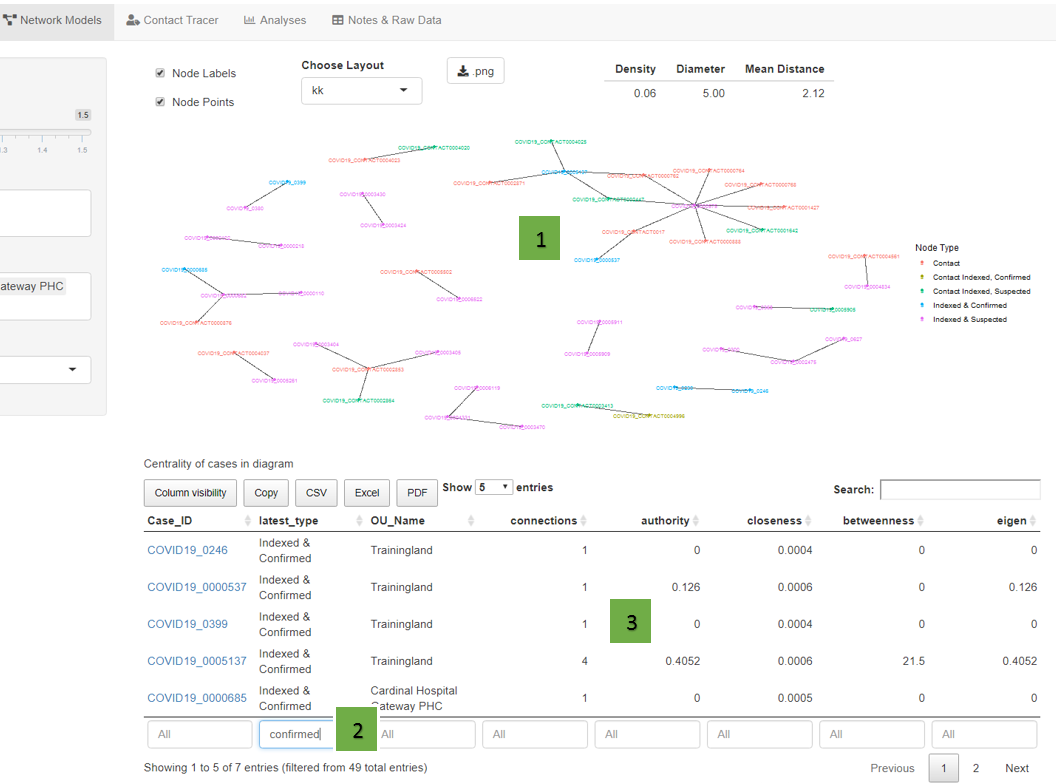
Let’s say you’re at a district or hospital and are sorting through confirmed Covid cases for follow-up. Some have no contacts, some have many. You look at the Network Model tab and filter to your location. You see two confirmed cases connected to a larger cluster; scanning the data, you see they have a higher “centrality” score than others.
When searching for one of the confirmed cases in the Contact Tracer tab, you see that the case has a contact of a contact that is a suspected case, with many recorded contacts, and whose symptoms started just days after the confirmed case. In all this case is less than 5 degrees removed from 11 contacts/cases. So you might want to start by calling the connections of this confirmed ID.
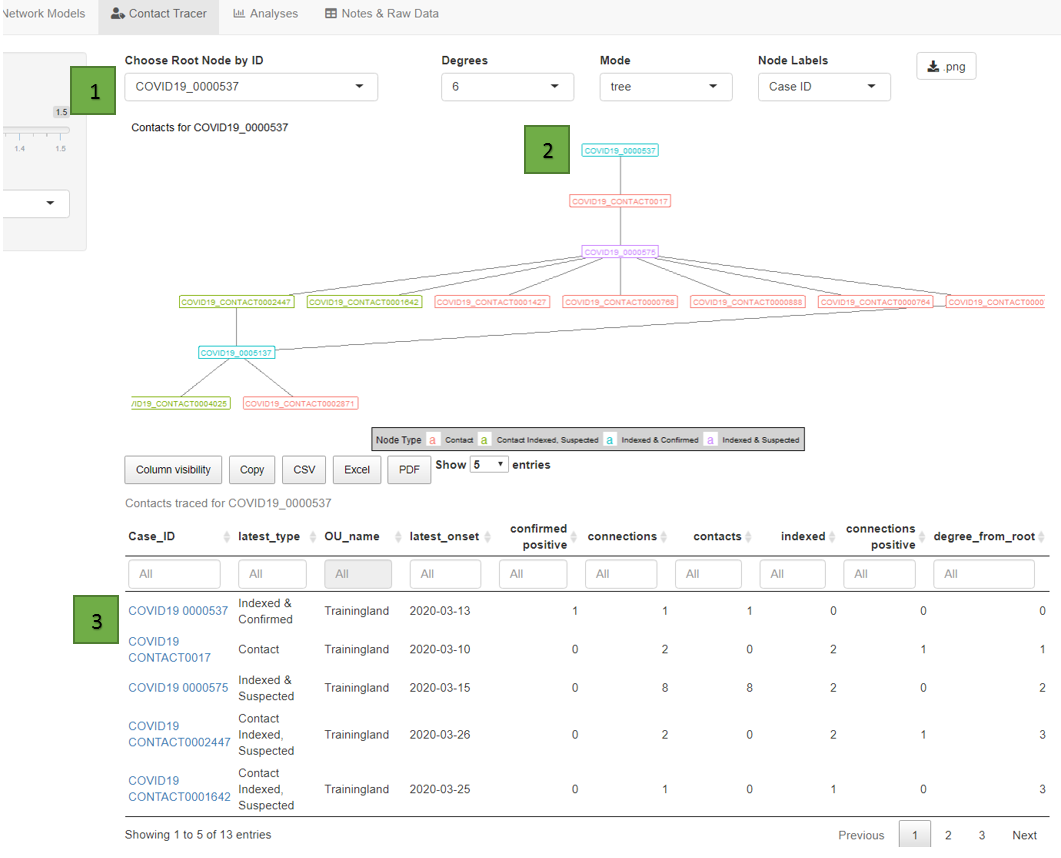
The contact tracer tab also helpfully lists the ID’s of all of the contacts connected to a single individual case. You can select any of these ID’s and it will take you directly to the tracker dashboard. This can potentially support follow-up workflows if you have the correct level of access, as with the current set of DHIS2 features you have to go to each index case’s tracker dashboard separately; here you can switch between them quite quickly by choosing a different root node ID.
How might this app support Covid-19 data analysis?
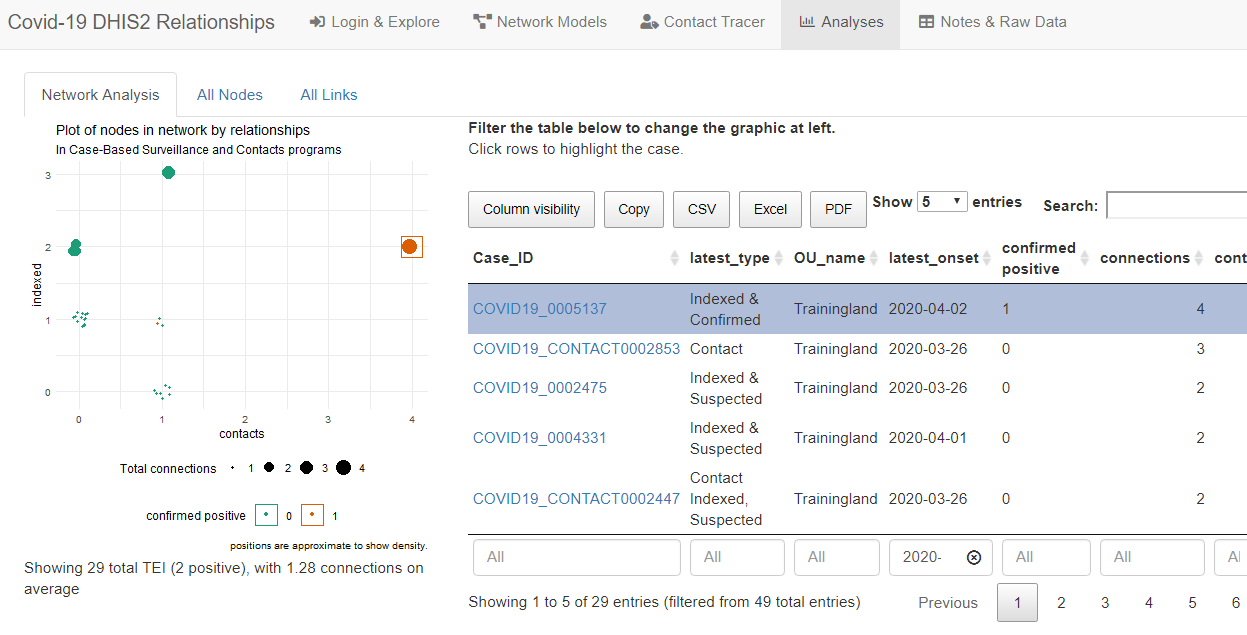
At a higher level, you can explore all relationships as an interactive network diagram, and see what types of cases (positive, suspected, contacts) are most commonly related. For example, in the Analysis tab, you can see the average number of contacts and suspected cases that are related to cases whose symptoms started in the last month. You can also download these data for use in other analysis software.
A generic network modeling app within DHIS2 should be available in the coming months, but this might be a useful tool in the short-term.
Cheers,
Brian
Disclaimer: this app has been tested on demo instances with 6000+ TEI, but not production systems. Please share your feedback on Github or below.