hello
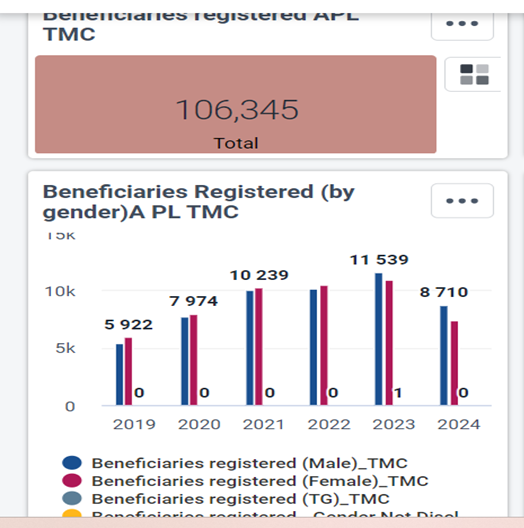
The Comma Separation in Figures is available in Pivot Table and Single Value visualizations but not in graphs/charts etc.Any way to use commas for all chart types?
hello
The Comma Separation in Figures is available in Pivot Table and Single Value visualizations but not in graphs/charts etc.Any way to use commas for all chart types?
Thank you for creating a separate topic for this request. I’ve summarized the request in the other topic but it’s good to continue this one here:
Like I mentioned I brought this up with the team for a discussion. Other community members are welcome to add their input. Thanks!

You can specify the default from the System Settings.
Best regards,
Jason
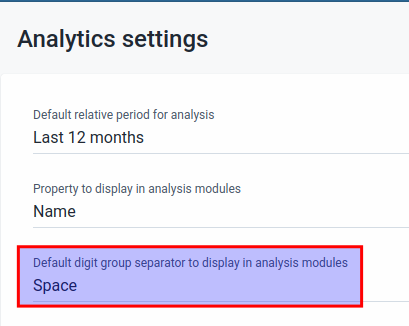
Thanks, Jason. I have selected Comma here in the analytics settings as per the project requirement. But that comma doesn’t appear in any other than the Pivot table and Single Value visualizations. The project person requires a comma in each visualization instead of a space.

See in the Single Value the Comma is displayed but in the Column Bar Chart Space is there in numbers. The project Requirement is to have the comma instead of Space

Hi @Neha_joshi
You’re right. Actually, @jason has shared this ticket [DHIS2-11346] - Jira . It looks like this is a feature request @dhis2-analytics is aware of.
It’s very good that you have a lot of feedback.