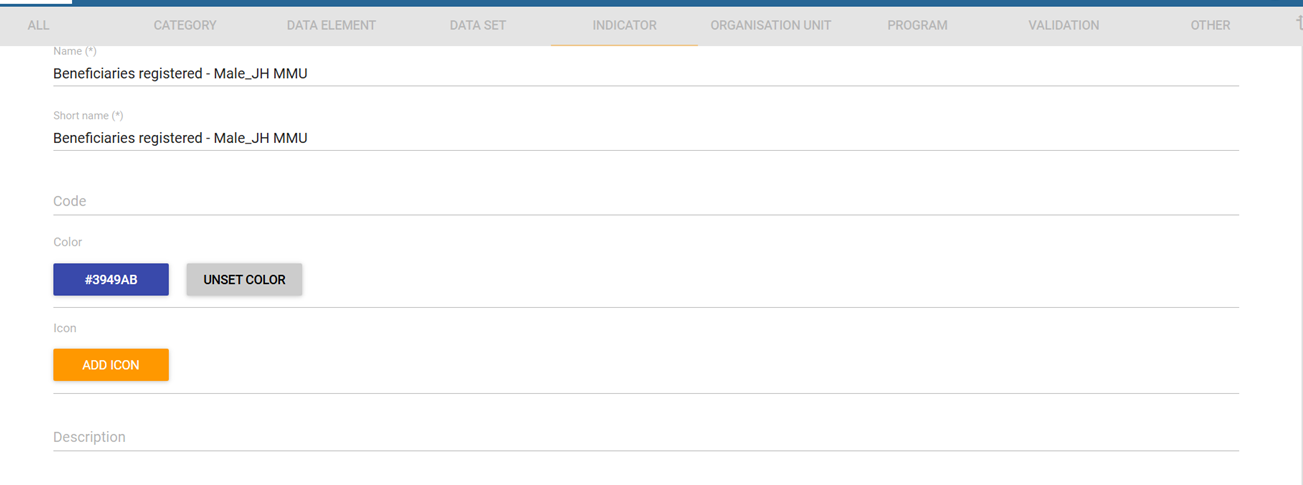
We have created a PI for Gender - Blue for Male , Pink for Female, Green for TG and Purple for Gender not disclosed. Then we created a Column chart in Data Visualizer with these PIs but the colors are not depicting in the Column chart. We are using 2.40.4. Please guide


Hi
Did you try to clear the cache? Would you please try again using your browser’s Guest mode?
I did but it didnt