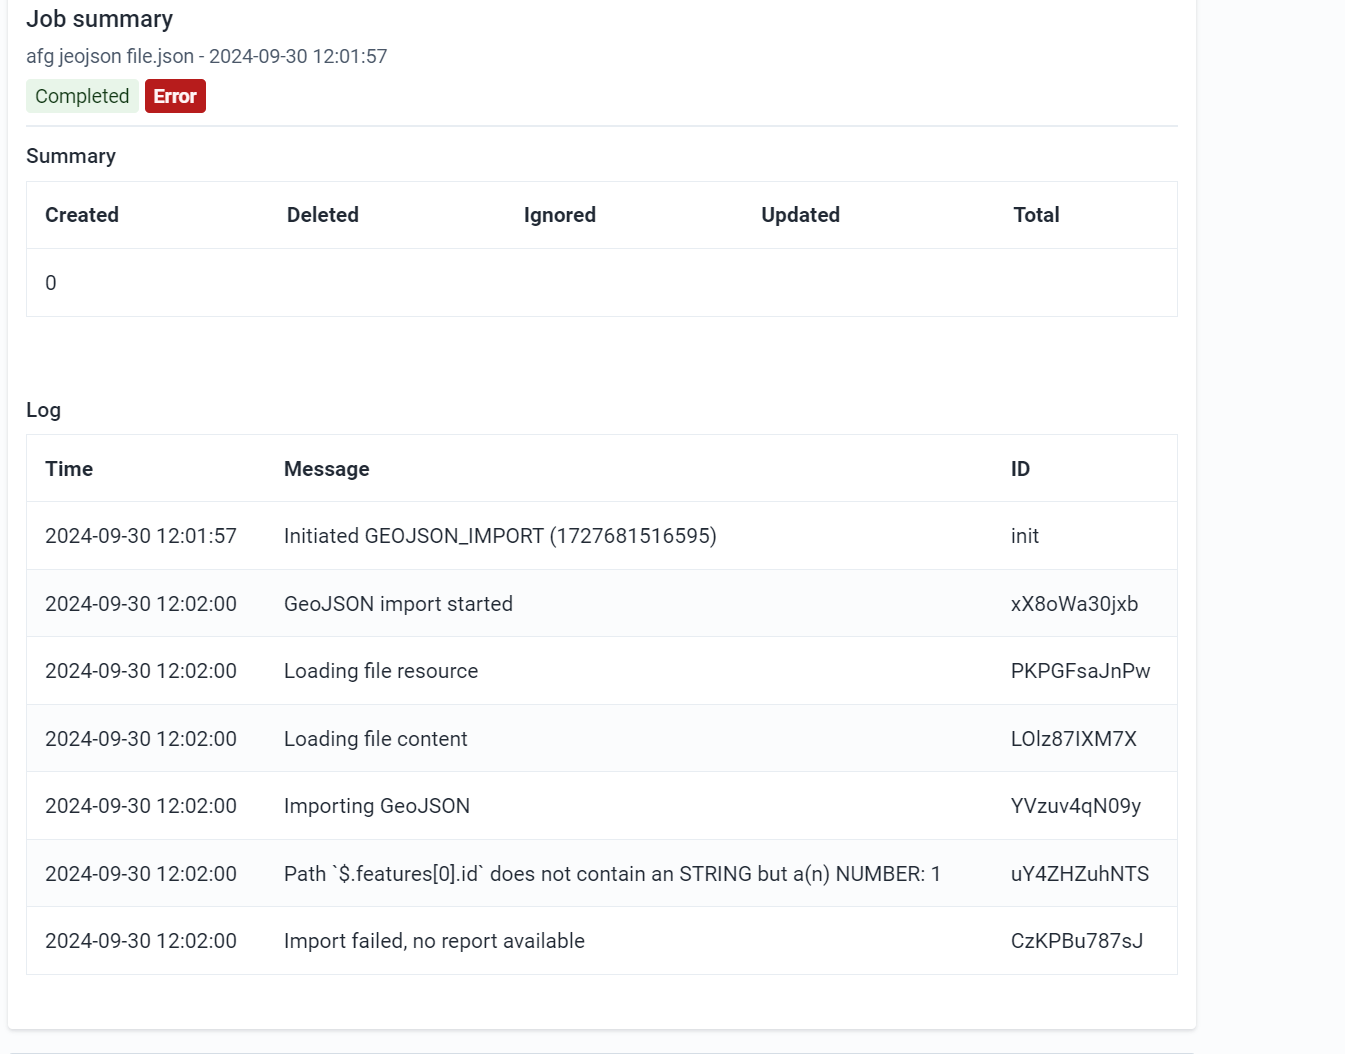
Please help me with this issue I tried a lot but it not work
Did you get the GEOJSON from the internet? If it’s a public file that can be shared publicly would you share the link so I could check it out on play.dhis2.org?
Thanks!
Thanks a million my Brother it had a problem with the name the organization name was different from the names on file I solved it.
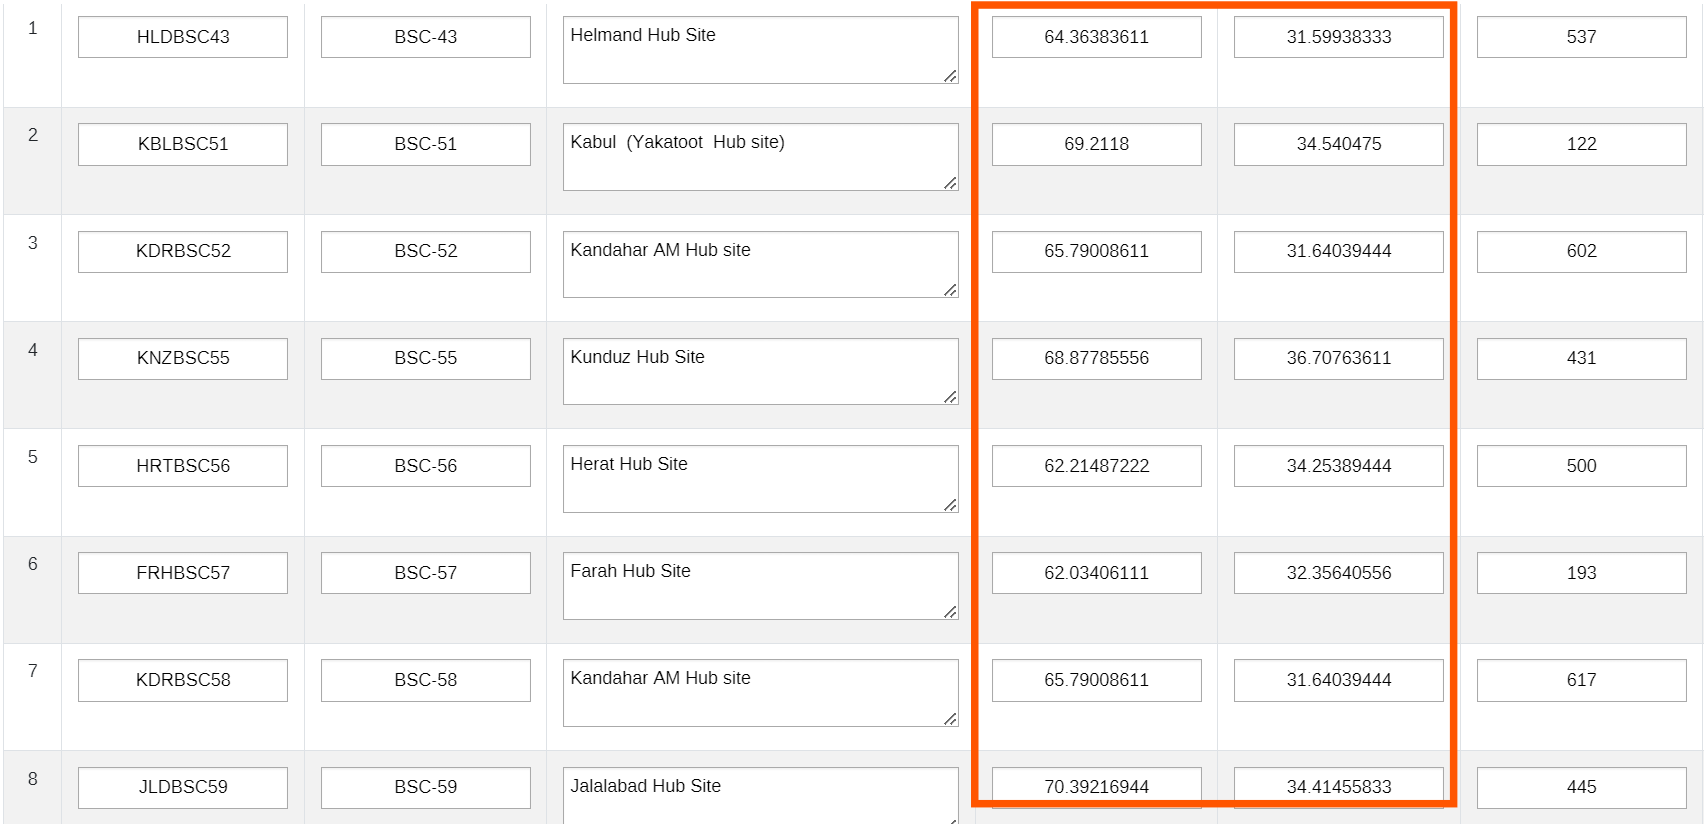
but now I want to add the bellow snapshot data in my map could you please help me you see the data have longitude and latitude columns I just want to show these things in maps.
1 Like
Hi @Aminulhaq_SADAT !
Nice to hear you managed to import your OrgUnit geometries.
To help you with the next step, could you clarify for us, what you are trying to display on a map.
Are these events? How are the coordinates represented, with a data element of type coordinates?
Best,
Bruno
1 Like
Thanks @Aminulhaq_SADAT ! Like @Bruno mentioned, it will help a lot if you’d explain the use case itself. ![]() The type of metadata, the type of map you’re trying to display…etc?
The type of metadata, the type of map you’re trying to display…etc?
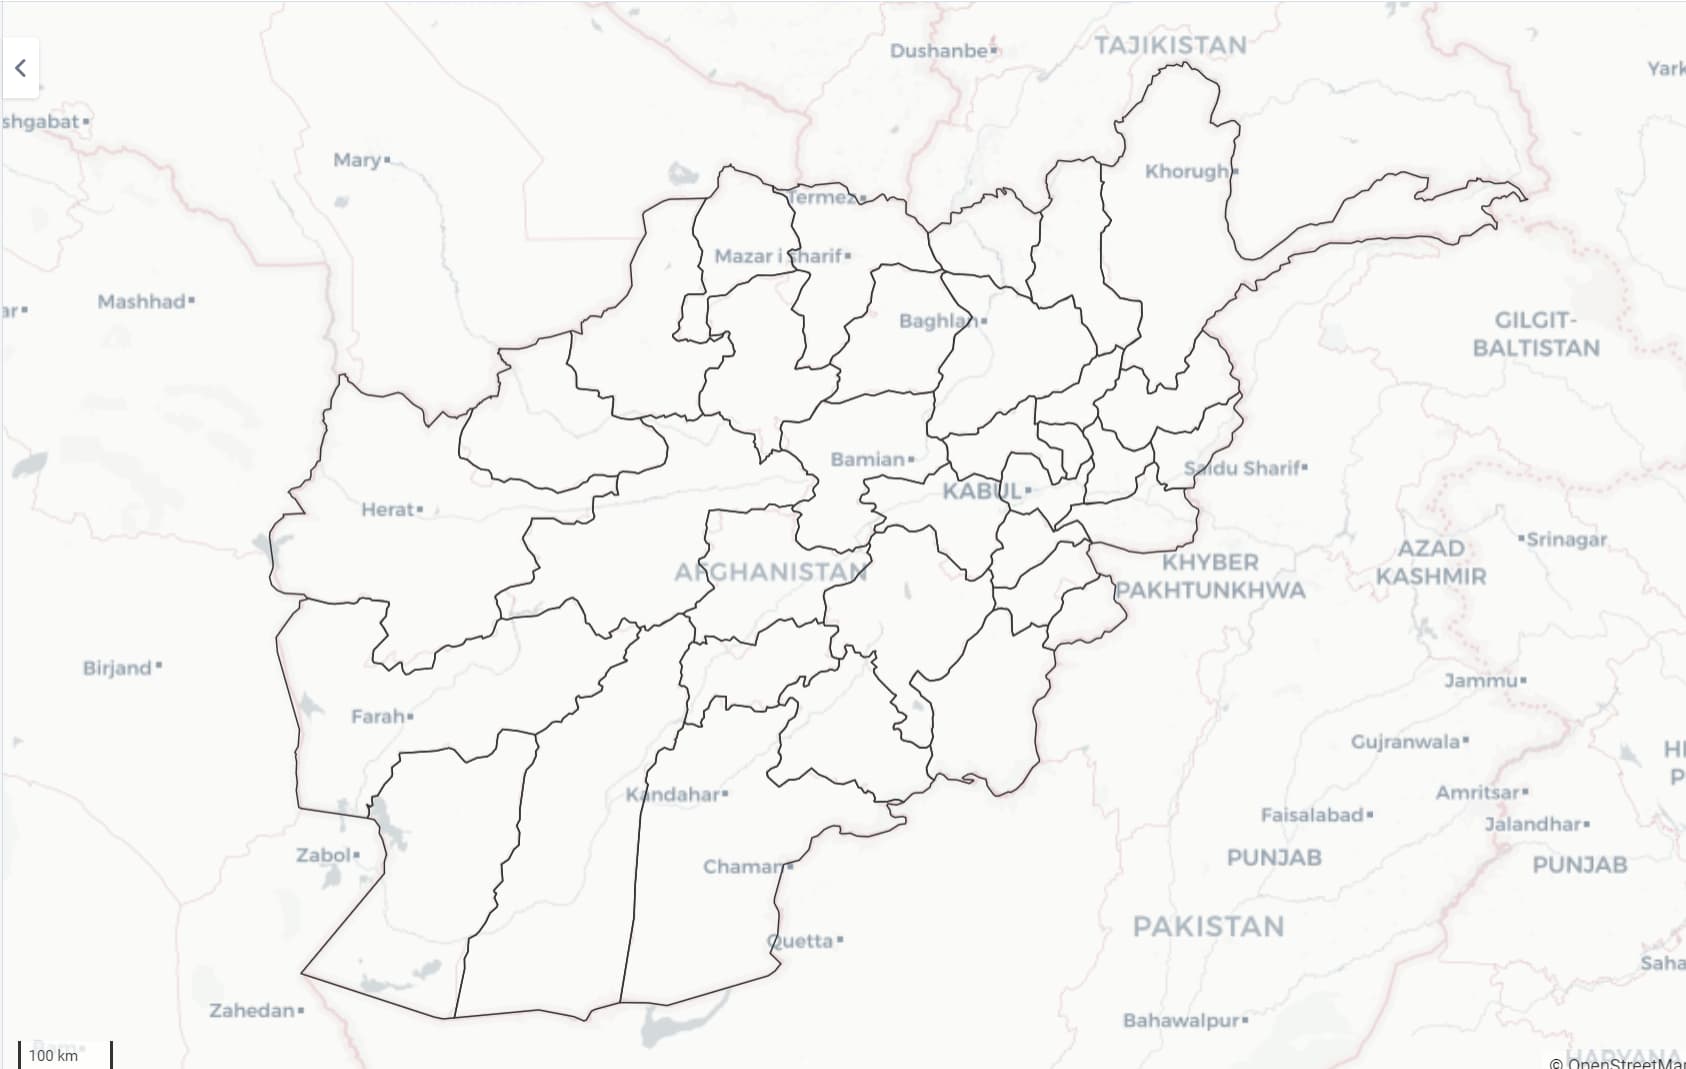
Are these coordinates for the Organization Units? For example, is Helmand Hub Site an OU and those are its coordinates? If so maybe a facility layer map such as the one below will work?
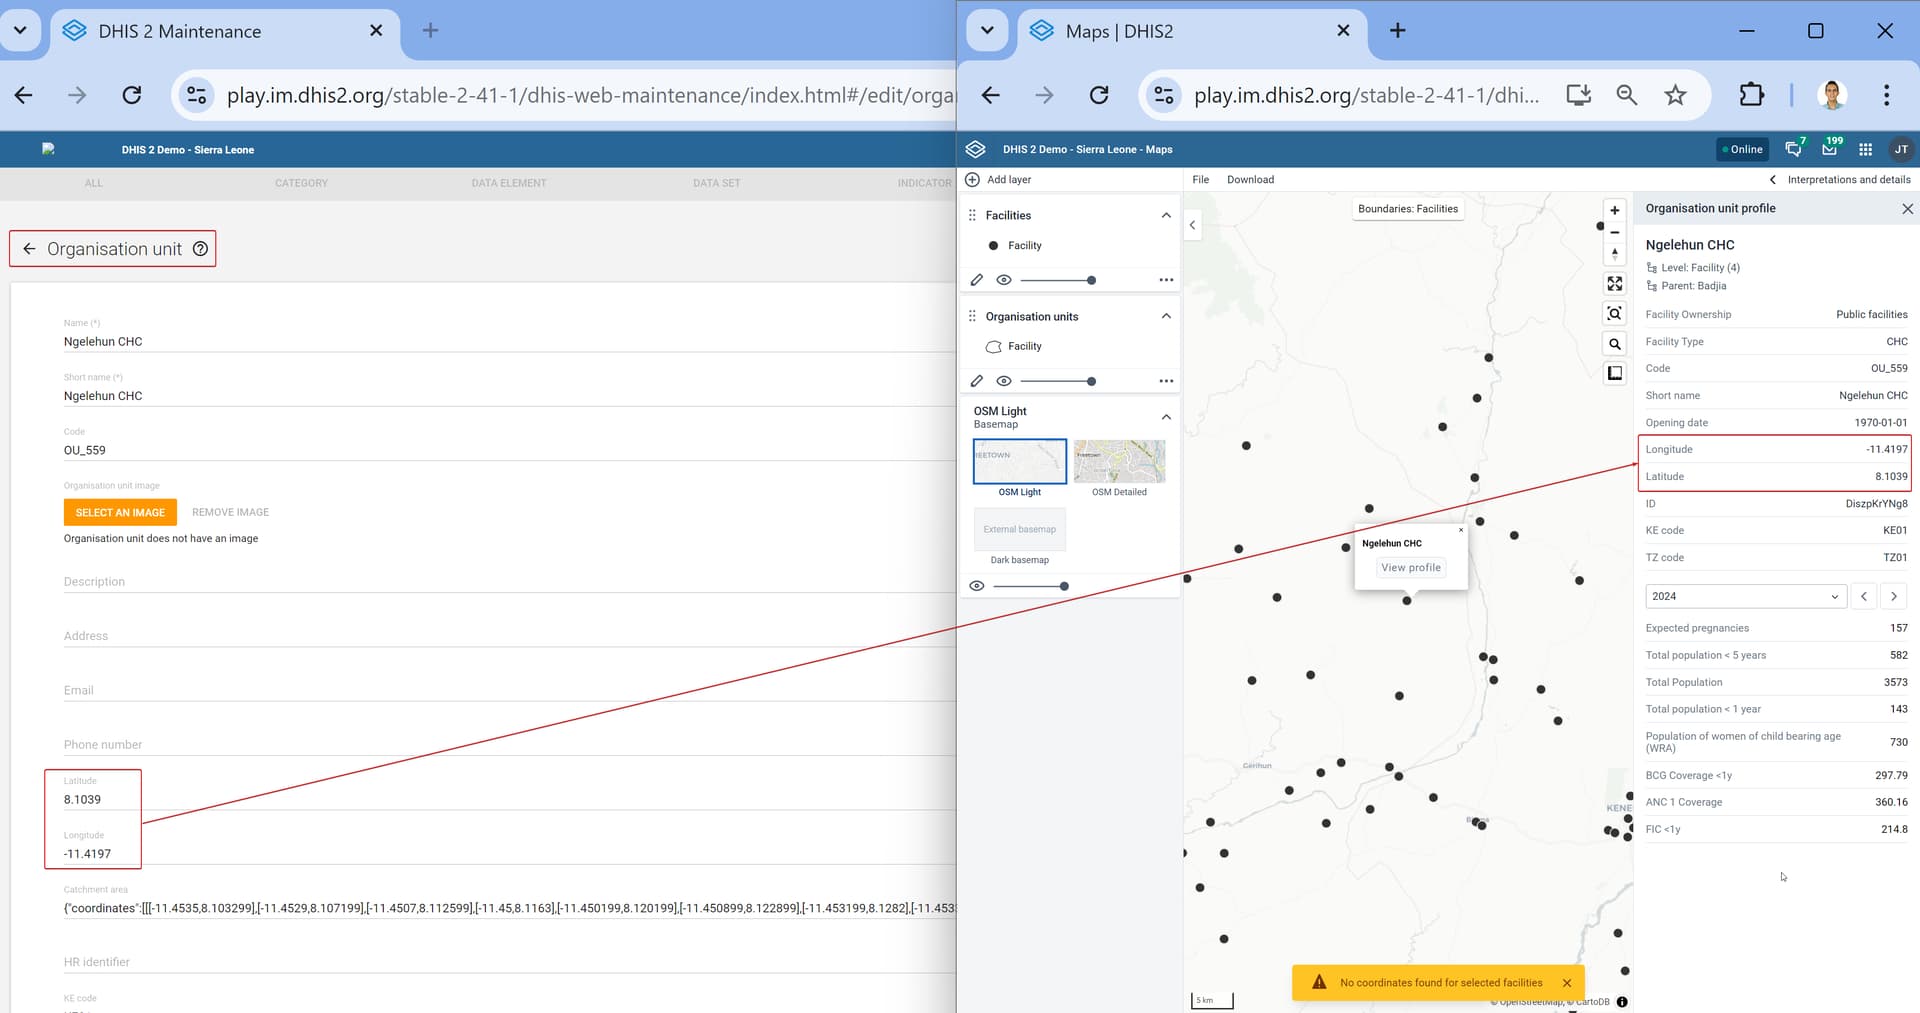
Note, you can check out the various types of maps on play and share an example of what you have in mind as well.
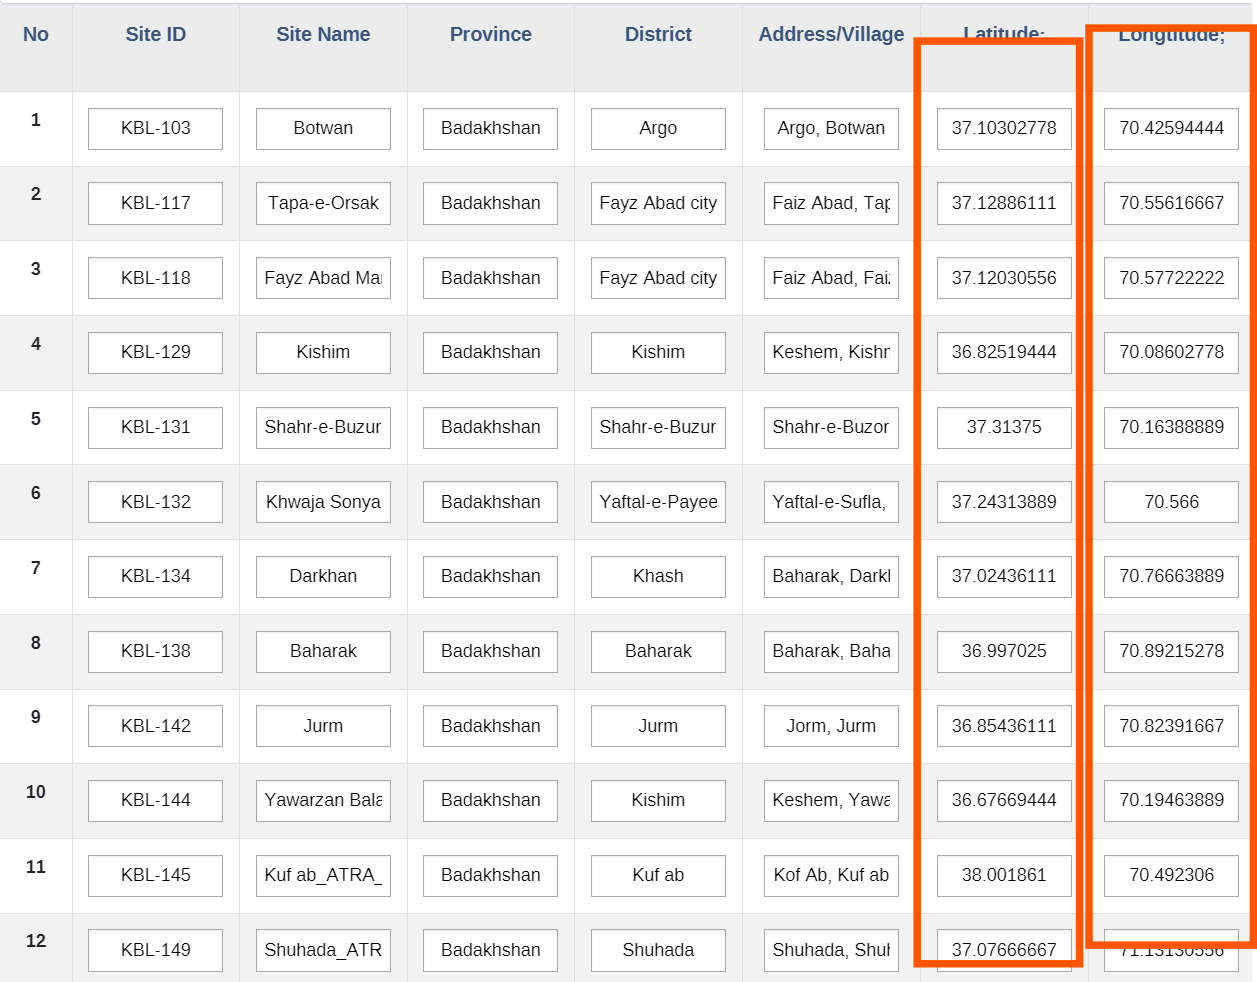
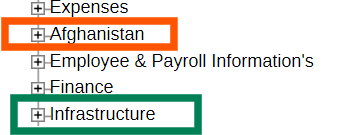
Hello Dear @Bruno and @Gassim sir, thank you very much for being here and for paying attention to my problem. I have an Organisation unit called “Afghanistan” in the system, which contains all the provinces displayed on the map through a JSON file. You can also view them in the unit section. Additionally, I have another Organisation unit called infrastructure where information is stored. This information is extensive, with possibly 500 records per province. You can see it some of it in the form these are in aggregate data format. I want to display this data on the map, showing how many centers are in each province and where each center is located. like I know how to show a center or something on map apps directly in creating an event or organisation unit and inserting latitude and longitude while creating it. please tell me how to do it from a data that we have it in dhis2 system in forms.
Hi @Aminulhaq_SADAT,
Thanks for sharing all these details.
There are a few point that attracts my attention.
It is not very clear to me how you attached geometries to your Organisation Units (OUs) in the hierarchy. You typically want to have Afghanistan > Provinces > Districts … [ref] and want to attach a polygon/point to each single Province, District, Facility OU [ref]. With this setup, you will be in a position to create a “thematic layers” in the Maps-app to visualize aggregated data by OU [ref].
- Have you attached geometries individually to each OU, or a single geometry to your “Afghanistan” main OU? If it is the second case, you probably want to change that.
- If you want to keep your “Afghanistan” and “Infrastructure” OUs separate, you will need to replicate (to some extent) the OU hierarchy there and also attach the geometries to visualize aggregate data captured in the “Infrastructure” OU.
- Unfortunately, in the Maps app, I believe we do not support the mapping of a “coordinates” data element from the aggregate domain (with a Thematic layer), you could count the number of site within each Province or District depending on how you OU hierarchy is designed, but not visualize them individually.
- I see two alternatives to map you sites: A) Use an event or tracker program, you will be able to visualize them individually with an event or tracker layer and count them by OU in an thematic layer. B) Have them as proper OU, that might be the route to go if each report data individually.
I hope this is helpful, but let me know if you need more details. We might also be able to bring people with more experience in implementations in the conversation.
Bruno
1 Like
Thank you, but the main problem with the system and the guide is that there is nothing in the academy or other YouTube videos that tell us how to enter the data into the system and then show it on the map. Most of the informational videos contain only map information on how the data should be displayed on the map. In my opinion, the first important thing is how to enter the data into the system so that the data can be displayed on the map. If you have any source of such information, share it with me so that I can analyze and solve this problem myself.
You might find this playlist helpful: https://www.youtube.com/playlist?list=PLo6Seh-066RztgX1wRAVjHXP4vgdzFdA0
Additionally, check out the course offered by HISP SA: HISP South Africa Map Course - #2 by Bjorn_Sandvik cc: @Norah_Stoops @Bjorn_Sandvik
1 Like